



4.3editor score
Turn spreadsheet data into charts and infographics with AI
AI SpreadsheetContact for Pricing
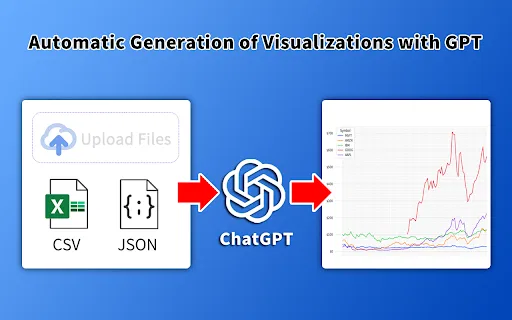
Turn spreadsheet data into charts and infographics with AI
AI SpreadsheetEditorial score: 4.3
Contact for Pricing
Compare AI products across 459 workflows using traffic estimates, features, and alternatives.

“Visual Regression” · Coding & Development·103 results
Start overTurn spreadsheet data into charts and infographics with AI
Turn spreadsheet data into charts and infographics with AI

Open-source agent observability that catches failures before your users do

AI-powered usability feedback for your website, right in your browser
AI-powered usability feedback for your website, right in your browser

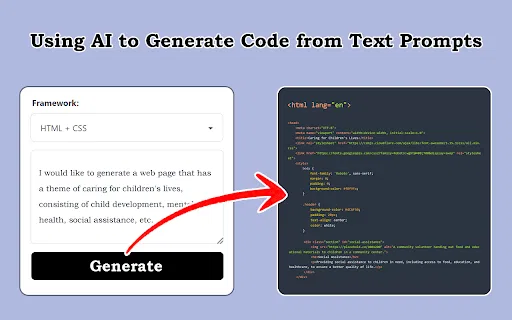
Turn screenshots, design drafts and prompts into front-end code
Turn screenshots, design drafts and prompts into front-end code

The simplest way to record AI-powered test scenarios for web and mobile
The simplest way to record AI-powered test scenarios for web and mobile

Beta AI features that make writing and reading Autify tests easier