
AI trading indicators, real-trade orderflow and charts in one platform
Danelfin records 216,830 monthly visits with -11.1% month-over-month growth and Freemium pricing. RunStocks records 0 monthly visits with 0% growth and Freemium, Free Trial pricing.

Historical gap, run and character analysis for active small-cap traders
| Dimension / Metric | ![]() | ![]() |
|---|---|---|
| Official Domain | danelfin.com | runstocks.com |
| Pricing Model | Freemium | Freemium, Free Trial |
| Monthly Visits | 216.83K (216,830) | 0 (0) |
| MoM Traffic Delta | -27.19K (-11.1%) | 0 (0%) |
| Primary Market & Share | 🇺🇸 United States (27%) | 🌐 Global (—) |
| Direct Visits / mo | 68.14K | 0 |
| User Rating | 4.2 | 4.3 |
| Supported Platforms | Website | Website |

AI-driven stock scores that rank every pickable stock by probability of beating the market
Every covered stock receives a 0-10 AI Score each day, computed from technical, fundamental, sentiment, and news features, with a clear probability-style read on its odds of beating the market.
Each score comes with a breakdown of the individual technical and fundamental indicators that lifted or dragged the rating, so the output is explainable rather than a black box.
Filter thousands of US and European tickers by score, sector, market cap, and trend, then pin favourites into watchlists for side-by-side comparison.
Track holdings, review aggregated portfolio-level scores, and browse curated top-rated lists for fresh trade ideas.

Historical gap, run and character analysis for active small-cap traders
Each ticker gets its own behavioural profile covering typical gap sizes, average run distance by catalyst type and pattern-matched historical comparables.
Browse years of gap-up and gap-down events and sustained runs, with multi-year event data available on Premium going back to 2022.
Minute-level reconstruction of a stock's biggest days, with volume profile overlays and key level identification to plan entries and exits.
Historical prices and metrics are adjusted daily for reverse splits and rights offerings, keeping every percentage and volume comparison accurate.

AI trading indicators, real-trade orderflow and charts in one platform
SpecialistCombines macroeconomic datasets with AI assistance, focusing heavily on global trend analysis rather than individual stock picks.
AI investing copilot for stock research, screening and market signals

An AI-powered trading journal with 600+ statistics and broker auto-sync
SpecialistAI-assisted, no-code automated trading strategies you can backtest and run

AI-driven market analysis for faster, data-backed investing decisions
Options flow, dark pools and dealer gamma with an AI analyst built in

Your portfolio's AI analyst, powered by alternative data

Real-time options order flow, dark pool data and AI trade alerts
SpecialistTrack pre-purchase intent and demand signals before they hit company KPIs
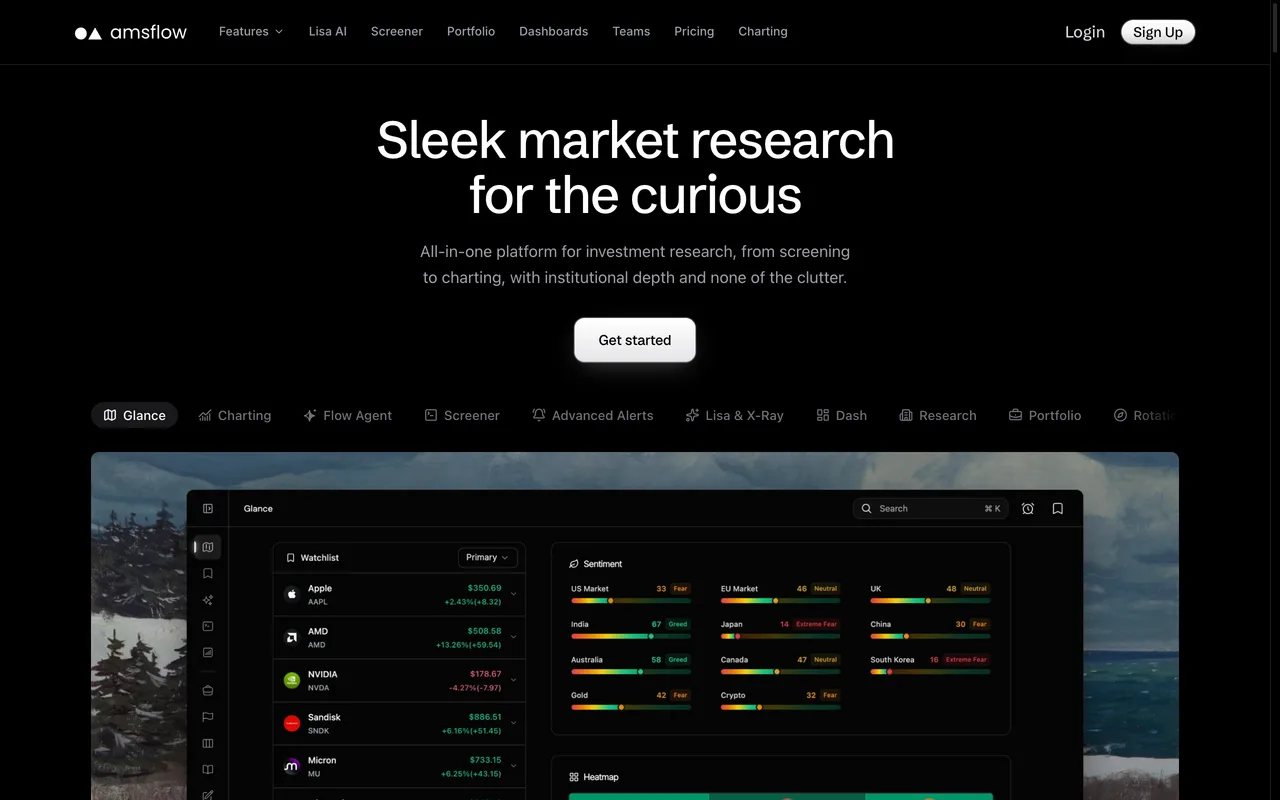
SpecialistInstitutional-depth market research with an AI copilot that builds, backtests, and screens for you

A live market workspace where chat, charts and evidence stay together