01
MiroOfficial
30.7M/mo
Offers an expansive infinite canvas for team brainstorming and visual workshops, but lacks Eraser's code-to-diagram automation.
AI Project ManagementEditorial score: 4.5Freemium, Contact for Pricing+1.7%
 #1
Eraser records 534,396 monthly visits with -23.6% month-over-month growth and Freemium, Paid, Contact for Pricing pricing. WatchTower records 2,216 monthly visits with +12% growth and Free, Open Source pricing.
AI diagrams and technical design docs built from your code and systems
Open-source DynamoDB capacity visualization with Amazon Bedrock AI insights
| Dimension / Metric | ||
|---|---|---|
| Official Domain | eraser.io | watch-tower.co |
| Pricing Model | Freemium, Paid, Contact for Pricing | Free, Open Source |
| Monthly Visits | 534.4K (534,396) | 2.22K (2,216) |
| MoM Traffic Delta | -164.9K (-23.6%) |
| +238 (+12%) |
| Primary Market & Share | 🇮🇳 India (39.6%) | 🇮🇳 India (38.8%) |
|---|
| Direct Visits / mo | 267.66K | 867 |
|---|
| User Rating | 4.6 | 4.4 |
|---|
| Supported Platforms | Website | Website |
|---|
AI diagrams and technical design docs built from your code and systems
Generate architecture diagrams, flowcharts, sequence diagrams, and BPMN from a text prompt, code, Terraform, or an uploaded PDF, Word, Excel, PowerPoint, Draw.io, or Visio file.
Build interactive maps that sync with cloud accounts, repositories, and internal catalogs so the picture stays close to the real environment, with drill-down from org level to a single container.
Paste code or connect private and public Git repositories, Confluence, Notion, VS Code, and GitHub to keep diagrams grounded in actual implementation.
Run the agent toolkit in your own infrastructure under an MIT license and let MCP-compatible clients create, search, update, and export diagrams with OAuth or API tokens.
Open-source DynamoDB capacity visualization with Amazon Bedrock AI insights
Connect with an AWS access key and secret key, then browse and monitor the DynamoDB tables in your account.
Pick a table and date range to generate clear graphs of provisioned versus consumed capacity, so you can judge whether provisioning is right-sized.
A one-click AI panel uses Amazon Bedrock (Mistral 7B Instruct by default) to turn raw capacity data into written insights and provisioning recommendations.
Optionally save generated analyses and metrics to a DynamoDB table in your own account, then regenerate graphs later to compare trends over time.
Offers an expansive infinite canvas for team brainstorming and visual workshops, but lacks Eraser's code-to-diagram automation.
#1Unified observability, security and incident response for cloud-scale engineering teams

SpecialistAutomatically embeds visual diagrams directly inside text documents, though it lacks Eraser's specialized cloud architecture focus.
 #3
Provides extensive drag-and-drop shapes and templates for general diagrams, but weaker automated code-to-diagram capabilities than Eraser.
Combines team whiteboarding, documentation, and diagramming in one platform, but less tailored for automated codebase architecture.

Free / Open-sourceEvaluate, monitor, and govern your AI applications in production

Free / Open-sourceFree real-time analytics for open source projects on GitHub


Free / Open-sourceThe open-source data layer for robotics and physical AI

Free / Open-sourceOpen-source tool specifically tailored for database schema visualization and ER diagrams, but lacks general system documentation features.

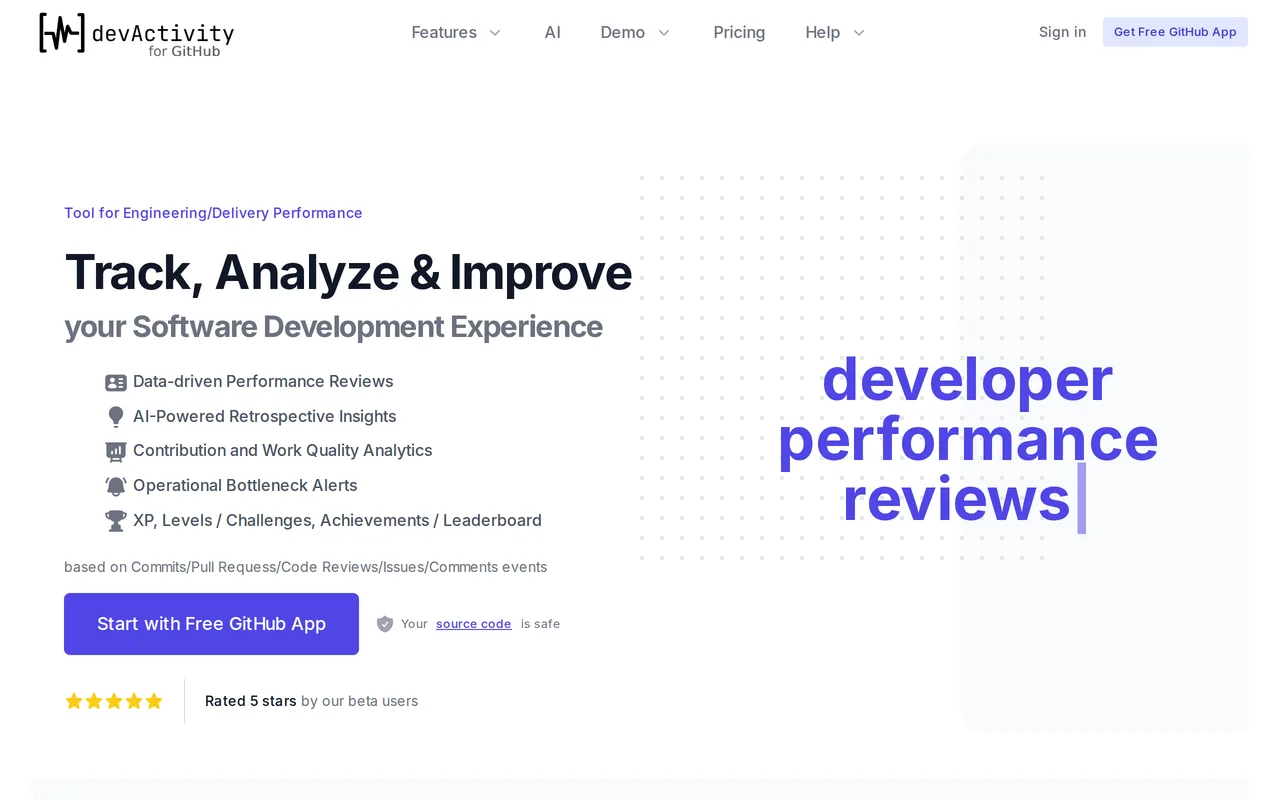
GitHub-native analytics for developer experience and team performance

Stronger focus on standard Mermaid syntax and code-driven diagrams, but lacks Eraser's native autonomous architecture doc generation.
Full-stack observability with an AI SRE agent that fixes issues
Offers an expansive infinite canvas for team brainstorming and visual workshops, but lacks Eraser's code-to-diagram automation.
Unified observability, security and incident response for cloud-scale engineering teams
SpecialistAutomatically embeds visual diagrams directly inside text documents, though it lacks Eraser's specialized cloud architecture focus.
Provides extensive drag-and-drop shapes and templates for general diagrams, but weaker automated code-to-diagram capabilities than Eraser.
Combines team whiteboarding, documentation, and diagramming in one platform, but less tailored for automated codebase architecture.
Free / Open-sourceEvaluate, monitor, and govern your AI applications in production
Free / Open-sourceFree real-time analytics for open source projects on GitHub
Free / Open-sourceOpen-source tool specifically tailored for database schema visualization and ER diagrams, but lacks general system documentation features.
GitHub-native analytics for developer experience and team performance
Stronger focus on standard Mermaid syntax and code-driven diagrams, but lacks Eraser's native autonomous architecture doc generation.
Full-stack observability with an AI SRE agent that fixes issues