3.8萬/月+26.7%
用 AI 將文字或資料變成可互動的圖表與示意圖
免費增值

依功能與用途,為你挑選 12 款 ChartAI 的替代工具。
| 排名 | 工具與標語 | 官方網域 | 每月造訪次數 | 月增幅 | 定價模式 | 主要市場 | 評分 | 比較 |
|---|---|---|---|---|---|---|---|---|
| ● |
| chartai.io |
| 2.04萬 |
| -1.82萬 (-47.2%) |
| 免費增值 |
| 美國 |
| 3.8 |
| 簡介 |
| 1 | AI Graph Maker | aigraphmaker.net | 3.83萬 | 8089 (+26.7%) | 免費增值 | 俄羅斯 | 4.1 | 比較 |
| 2 | Graphy | graphy.app | 8.12萬 | -2.96萬 (-26.7%) | 免費增值 | 美國 | 4.3 | 比較 |
| 3 | Diagramming AI | diagrammingai.com | 1.46萬 | -6390 (-30.5%) | 免費增值、免費試用 | 印度 | 4.4 | 比較 |
| 4 | Julius AI | julius.ai | 66.55萬 | 3.18萬 (+5%) | 免費試用、需聯絡報價 | 印度 | 4.4 | 比較 |
| 5 | Mermaid Chart | mermaidchart.com | 4.6萬 | 3.86萬 (+519%) | 免費增值、免費試用 | 美國 | 4.6 | 比較 |
| 6 | Edraw.AI | edraw.ai | 21.65萬 | -2.51萬 (-10.4%) | 免費增值、免費試用、付費 | 美國 | 4.2 | 比較 |
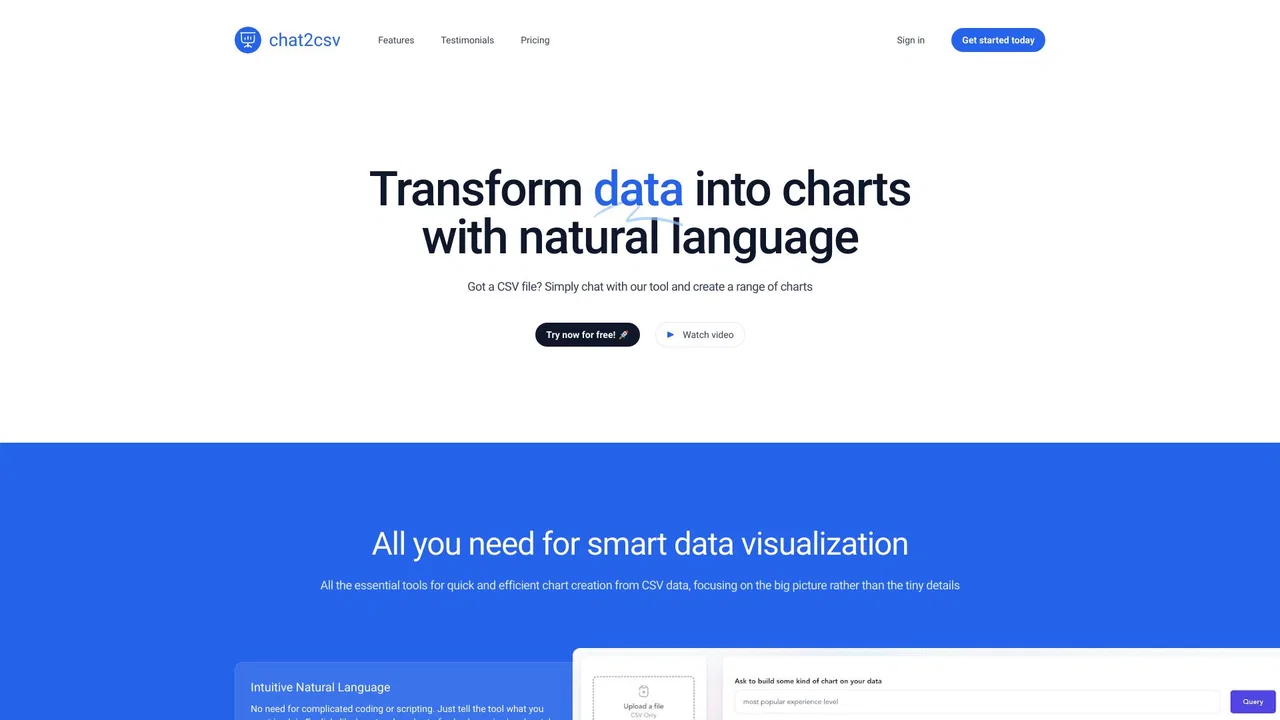
| 7 | Chat2CSV | chat2csv.com | 71 | -337 (-82.6%) | 免費增值 | 美國 | 4.1 | 比較 |
| 8 | ChartPixel | chartpixel.com | 3036 | -654 (-17.7%) | 免費增值、付費、需聯絡報價 | 美國 | 4.1 | 比較 |
| 9 | Ultimaps | ultimaps.com | 15.17萬 | -1.93萬 (-11.3%) | 免費增值 | 美國 | 4.4 | 比較 |
| 10 | ChartCool | ai.ichartcool.com | 0 | 0 (0%) | 免費增值、免費 | 全球 | 4 | 比較 |
| 11 | RapidChart.ai | rapidcharts.ai | 6805 | -9593 (-58.5%) | 免費 | 美國 | 4.2 | 比較 |
| 12 | SciDraw AI | sci-draw.com | 14.65萬 | 1.35萬 (+10.1%) | 免費增值 | 美國 | 4.2 | 比較 |
用 AI 將文字或資料變成可互動的圖表與示意圖
以 AI 對話生成與編輯 Mermaid、PlantUML、Excalidraw 圖表
用文字、程式碼或一句話生成圖表
人人都能用的 AI 資料分析與圖表生成
Ultimaps is a browser-based map maker that turns spreadsheet data into styled visualizations. Pick from hundreds of pre-built maps of the world, countries, US states, counties or ZIP codes, then color regions manually or import from Excel, CSV, Google Sheets or Notion. It builds color scales and legends automatically, supports pins from addresses, and exports PNG, SVG or PDF or publishes an embeddable interactive map.
Ultimaps is a browser-based map maker that turns spreadsheet data into styled visualizations. Pick from hundreds of pre-built maps of the world, countries, US states, counties or ZIP codes, then color regions manually or import from Excel, CSV, Google Sheets or Notion. It builds color scales and legends automatically, supports pins from addresses, and exports PNG, SVG or PDF or publishes an embeddable interactive map.
幾分鐘而非幾小時,生成專業技術圖。

專項更強SciDraw AI turns a text description, a rough sketch or a CSV file into publication-ready scientific illustrations and journal-styled charts, exporting fully editable SVG and PPTX vector files instead of flat images.
專項更強SciDraw AI turns a text description, a rough sketch or a CSV file into publication-ready scientific illustrations and journal-styled charts, exporting fully editable SVG and PPTX vector files instead of flat images.