翻譯完成前,部分內容暫以英文顯示。
依功能與用途,為你挑選 12 款 ChartGen.ai 的替代工具。
| 排名 | 工具與標語 | 官方網域 | 每月造訪次數 | 月增幅 | 定價模式 | 主要市場 | 評分 | 比較 |
|---|---|---|---|---|---|---|---|---|
| ● | ChartGen.ai | chartgen.ai | 13.92萬 | -8699 (-5.9%) |
| 印度 |
| — |
| 簡介 |
| 1 | Julius AI | julius.ai | 66.55萬 | 3.18萬 (+5%) | 免費試用、需聯絡報價 | 印度 | 4.4 | 比較 |
| 2 | Graphy | graphy.app | 8.12萬 | -2.96萬 (-26.7%) | 免費增值 | 美國 | 4.3 | 比較 |
| 3 | Napkin AI | napkin.ai | 103萬 | -21.81萬 (-17.5%) | 免費增值 | 印度 | 4.7 | 比較 |
| 4 | Sourcetable — AI 試算表與資料分析師 | sourcetable.com | 3.85萬 | 4479 (+13.2%) | 免費增值、免費試用、付費 | 美國 | 4.4 | 比較 |
| 5 | Basedash | basedash.com | 7.55萬 | 8530 (+12.7%) | 免費試用、付費、需聯絡報價 | 美國 | 4.3 | 比較 |
| 6 | ChartAI | chartai.io | 2.04萬 | -1.82萬 (-47.2%) | 免費增值 | 美國 | 3.8 | 比較 |
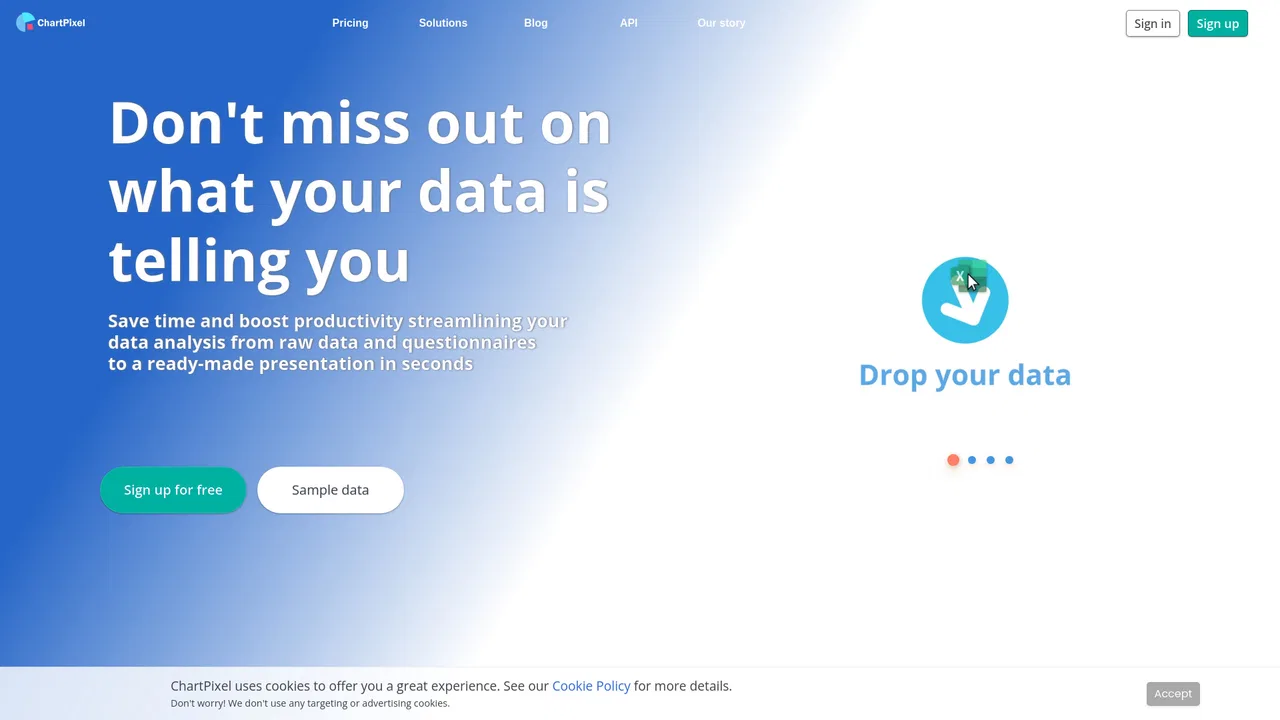
| 7 | ChartPixel | chartpixel.com | 3036 | -654 (-17.7%) | 免費增值、付費、需聯絡報價 | 美國 | 4.1 | 比較 |
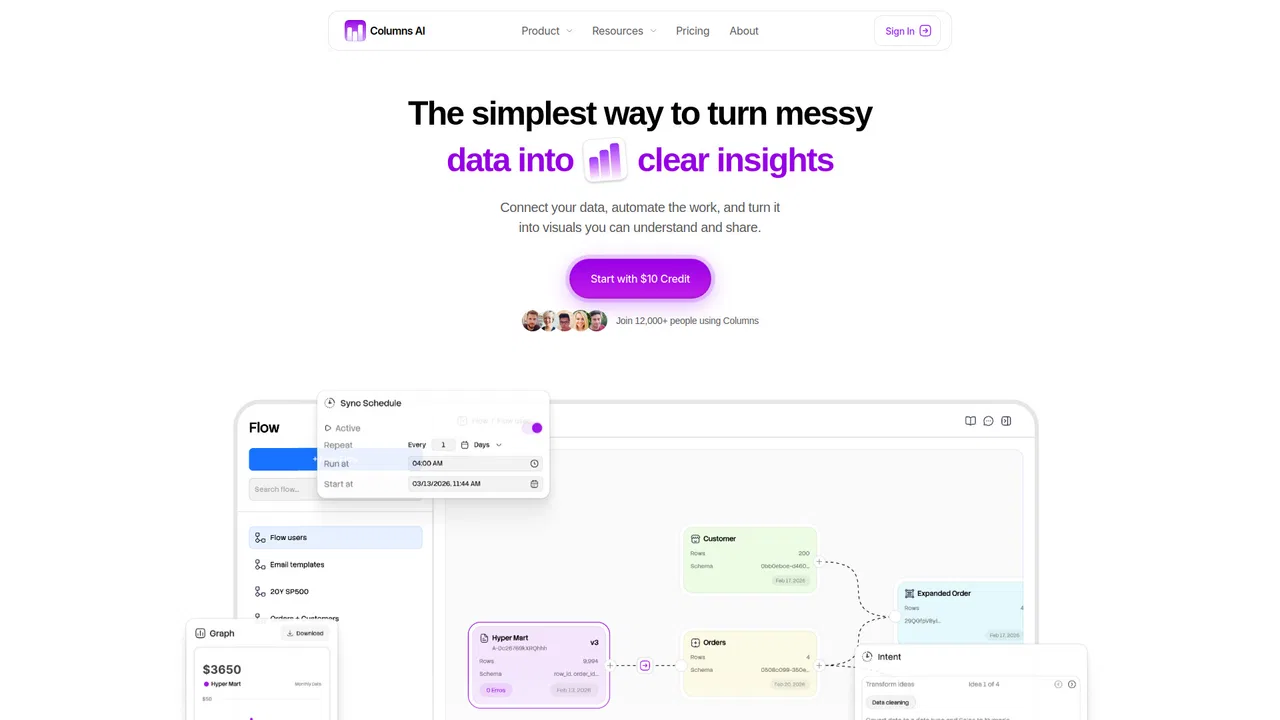
| 8 | Columns AI | columns.ai | 1387 | -788 (-36.2%) | 免費增值、付費 | 美國 | 4.2 | 比較 |
| 9 | ExcelDashboard AI | exceldashboard.ai | 1.15萬 | 2104 (+22.3%) | 免費增值 | 印度 | 4.3 | 比較 |
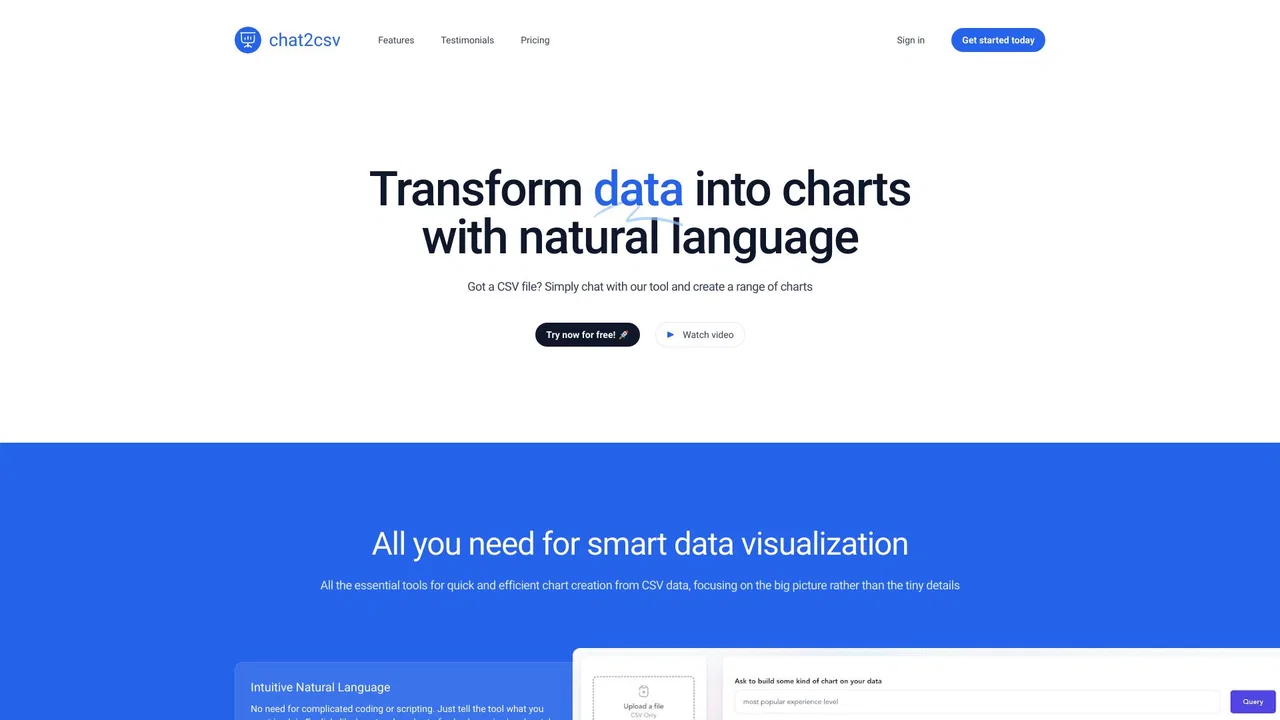
| 10 | Chat2CSV | chat2csv.com | 71 | -337 (-82.6%) | 免費增值 | 美國 | 4.1 | 比較 |
| 11 | ChartCool | ai.ichartcool.com | 0 | 0 (0%) | 免費增值、免費 | 全球 | 4 | 比較 |
| 12 | Hex | hex.tech | 78.27萬 | 7.66萬 (+10.8%) | 免費增值、免費試用、付費、需聯絡報價、免費 | 美國 | 4.7 | 比較 |

結合了 AI 試算表介面與自動圖表製作,但本質上仍是以完整試算表運作。
Turns messy data tables into clean charts and statistical insights automatically.

Transforms raw files into interactive charts and dashboards, though with fewer advanced analytics features.

專項更強Specializes in turning Excel and CSV data into interactive KPI dashboards and PowerPoint slides.

Offers simple conversational charting from CSV uploads, but lacks advanced data modeling.
Converts plain-language prompts and data into polished visualizations instantly.

專項更強Provides powerful collaborative notebooks and agentic analytics for data teams, but has a more advanced workflow.