01
加载中…
此翻译正在进行中,部分内容可能仍显示英文。
根据功能和用途,为你挑选 12 款 ChartGen.ai 的替代工具。
| 排名 | 工具和标语 | 官方域名 | 月访问量 | 月度增长 (MoM) | 定价模式 | 主要市场 | 评分 | 比较 |
|---|---|---|---|---|---|---|---|---|
| ● | ChartGen.ai | chartgen.ai | 13.92万 | -8699 (-5.9%) | 灵活 | 印度 | — | 概览 |
| 1 | Julius AI | julius.ai | 66.55万 | 3.18万 (+5%) | 免费试用,定价请咨询 | 印度 | 4.4 | 比较 |
| 2 | Graphy | graphy.app | 8.12万 | -2.96万 (-26.7%) | 免费增值 | 美国 | 4.3 | 比较 |
| 3 | Napkin AI | napkin.ai | 103万 | -21.81万 (-17.5%) | 免费增值 | 印度 | 4.7 | 比较 |
| 4 | Sourcetable — AI 电子表格与数据分析师 | sourcetable.com | 3.85万 | 4479 (+13.2%) | 免费增值,免费试用,付费 | 美国 | 4.4 | 比较 |
| 5 | Basedash | basedash.com | 7.55万 | 8530 (+12.7%) | 免费试用,付费,定价请咨询 | 美国 | 4.3 | 比较 |
| 6 | ChartAI | chartai.io | 2.04万 | -1.82万 (-47.2%) | 免费增值 | 美国 | 3.8 | 比较 |
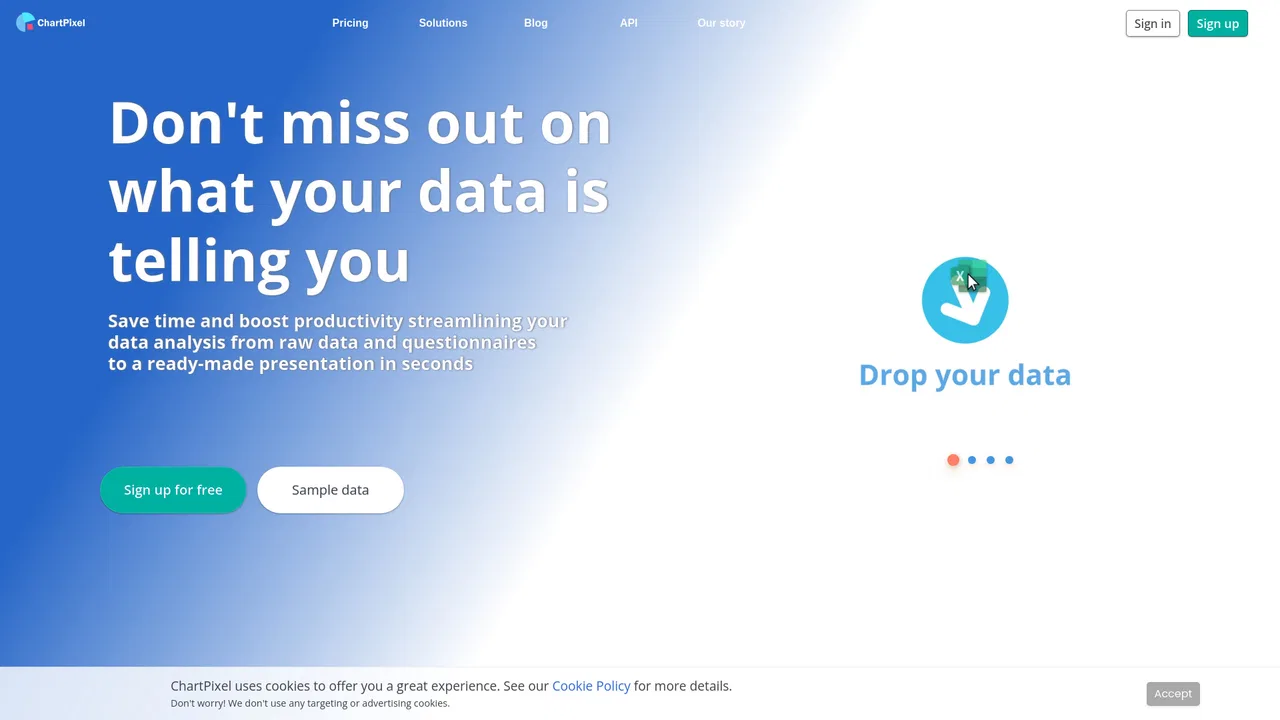
| 7 | ChartPixel | chartpixel.com | 3036 | -654 (-17.7%) | 免费增值,付费,定价请咨询 | 美国 | 4.1 | 比较 |
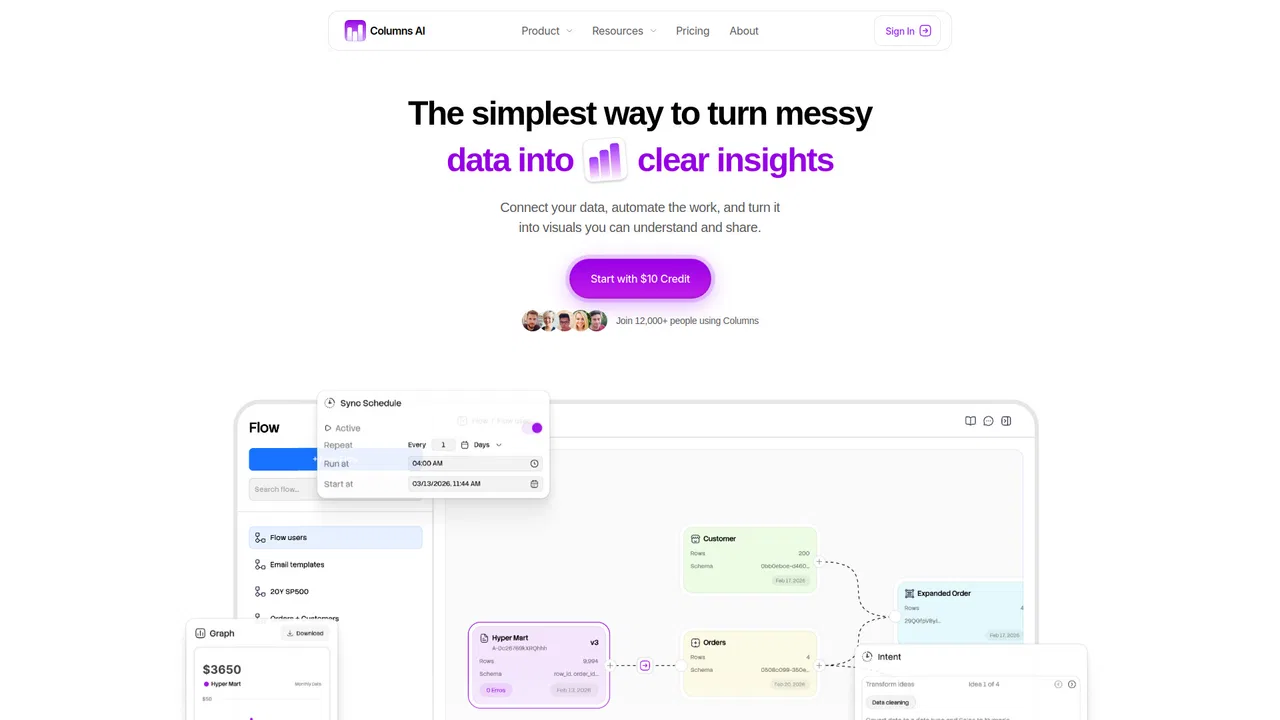
| 8 | Columns AI | columns.ai | 1387 | -788 (-36.2%) | 免费增值,付费 | 美国 | 4.2 | 比较 |
| 9 | ExcelDashboard AI | exceldashboard.ai | 1.15万 | 2104 (+22.3%) | 免费增值 | 印度 | 4.3 | 比较 |
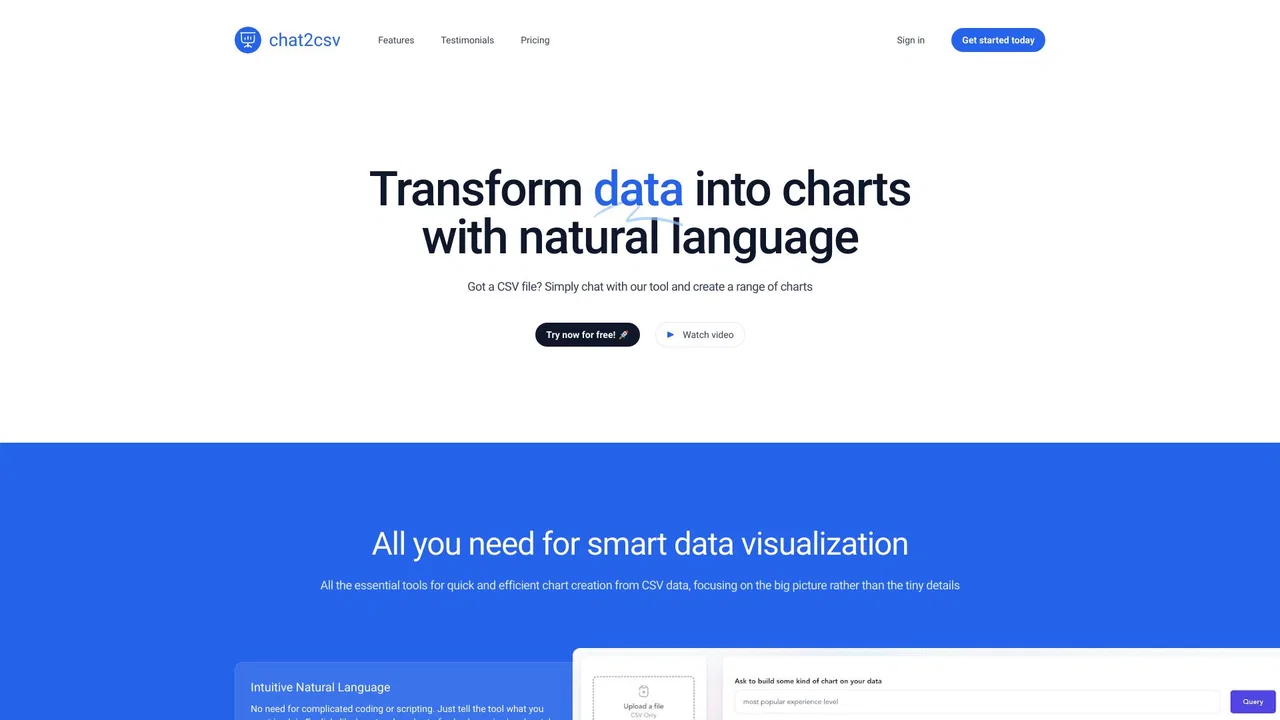
| 10 | Chat2CSV | chat2csv.com | 71 | -337 (-82.6%) | 免费增值 | 美国 | 4.1 | 比较 |
| 11 | ChartCool | ai.ichartcool.com | 0 | 0 (0%) | 免费增值,免费 | 全球 | 4 | 比较 |
| 12 | Hex | hex.tech | 78.27万 | 7.66万 (+10.8%) | 免费增值,免费试用,付费,定价请咨询,免费 | 美国 | 4.7 | 比较 |

 #3

结合了 AI 试算表界面与自动图表制作,但本质上仍是以完整试算表运作。

专项更强将自然语言转换为数据库仪表板与 SQL 查询,最适合即时数据库连线。

Turns messy data tables into clean charts and statistical insights automatically.

Transforms raw files into interactive charts and dashboards, though with fewer advanced analytics features.

专项更强Specializes in turning Excel and CSV data into interactive KPI dashboards and PowerPoint slides.

Offers simple conversational charting from CSV uploads, but lacks advanced data modeling.
Converts plain-language prompts and data into polished visualizations instantly.

专项更强Provides powerful collaborative notebooks and agentic analytics for data teams, but has a more advanced workflow.
提供深入的统计分析与 Python 执行能力,但比简单的即时图表生成器来得笨重。
结合了 AI 试算表界面与自动图表制作,但本质上仍是以完整试算表运作。
专项更强将自然语言转换为数据库仪表板与 SQL 查询,最适合即时数据库连线。
Turns messy data tables into clean charts and statistical insights automatically.
Transforms raw files into interactive charts and dashboards, though with fewer advanced analytics features.
专项更强Specializes in turning Excel and CSV data into interactive KPI dashboards and PowerPoint slides.
Converts plain-language prompts and data into polished visualizations instantly.
专项更强Provides powerful collaborative notebooks and agentic analytics for data teams, but has a more advanced workflow.