



4.3editor score
Turn spreadsheet data into charts and infographics with AI
AI SpreadsheetContact for Pricing
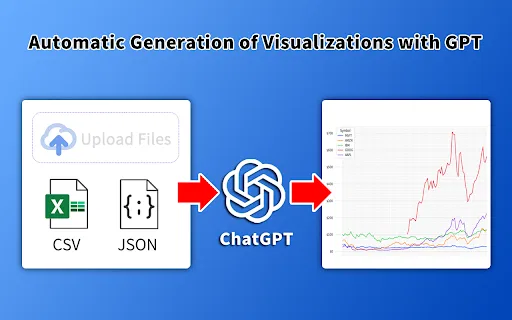
Turn spreadsheet data into charts and infographics with AI
AI SpreadsheetEditorial score: 4.3
Contact for Pricing
Compare AI products across 459 workflows using traffic estimates, features, and alternatives.

“Design Visualization” · Coding & Development·15 results
Start overTurn spreadsheet data into charts and infographics with AI
Turn spreadsheet data into charts and infographics with AI

Turn a plain-language system description into a UML diagram in your browser
Turn a plain-language system description into a UML diagram in your browser

Turn any screenshot into an editable wireframe in seconds

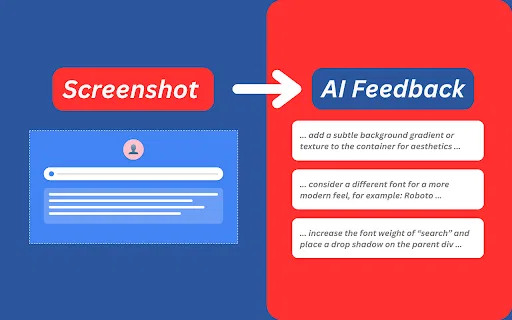
AI design feedback on any website, right from your Chrome toolbar
AI design feedback on any website, right from your Chrome toolbar

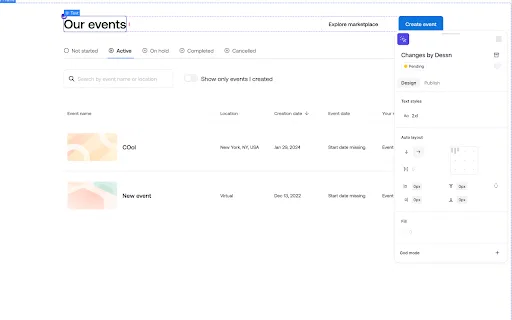
Design directly on your production codebase, on a shared canvas
Design directly on your production codebase, on a shared canvas

Predict viewer attention on any page from your browser toolbar
Predict viewer attention on any page from your browser toolbar

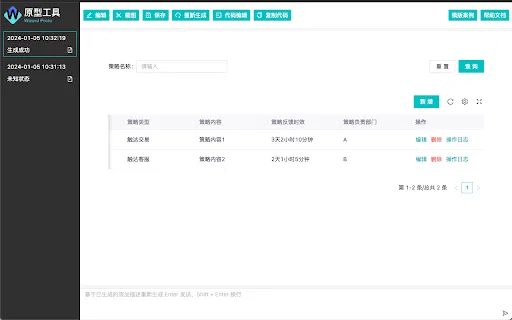
Turn plain text descriptions into working page prototypes
Turn plain text descriptions into working page prototypes

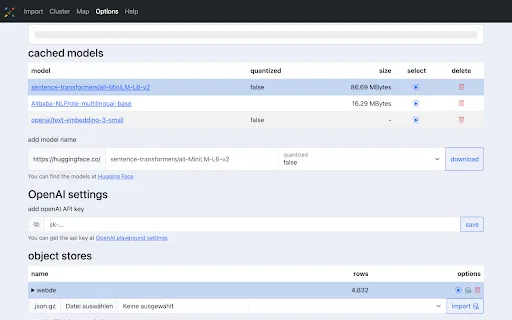
Experiment With Text Embeddings in Your Browser

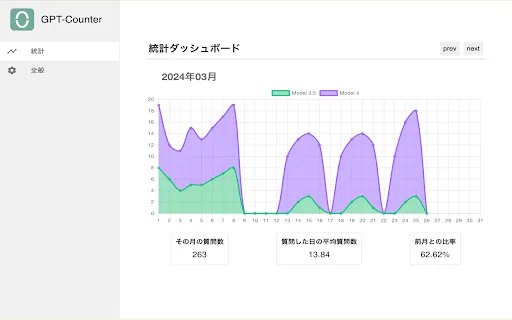
A Chrome extension that limits and visualizes how much you rely on ChatGPT
A Chrome extension that limits and visualizes how much you rely on ChatGPT

Korean public data analysis in one click, powered by AI
Korean public data analysis in one click, powered by AI

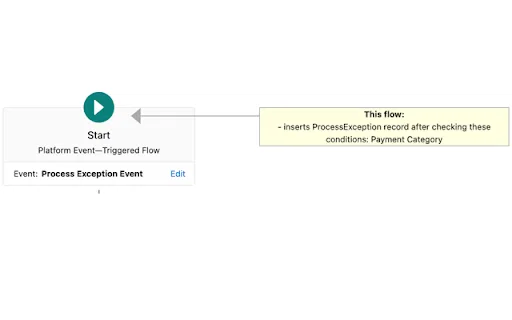
Visualize Salesforce flows and explain them with GPT

Zero-Click Intelligence injected into every web page you open

Turn any piano audio on the web into an interactive waterfall lesson
Turn any piano audio on the web into an interactive waterfall lesson

Mask personal data on screen and read the mood of any page
Mask personal data on screen and read the mood of any page

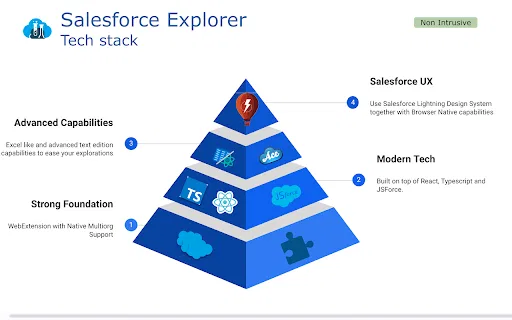
A power-tool workspace for Salesforce admins and developers
A power-tool workspace for Salesforce admins and developers