




50.1K/mo
Agentic design canvas that ships real code
AI Developer ToolsEditorial score: 4.5Freemium57% direct

50.1K/mo
Agentic design canvas that ships real code
Freemium
Compare AI products across 459 workflows using traffic estimates, features, and alternatives.
“Graph Plotter”·101 results
Start overAgentic design canvas that ships real code
Agentic design canvas that ships real code

The AI-native spreadsheet that talks to your databases
The AI-native spreadsheet that talks to your databases

30+ free Minecraft tools for players, builders and server owners
30+ free Minecraft tools for players, builders and server owners
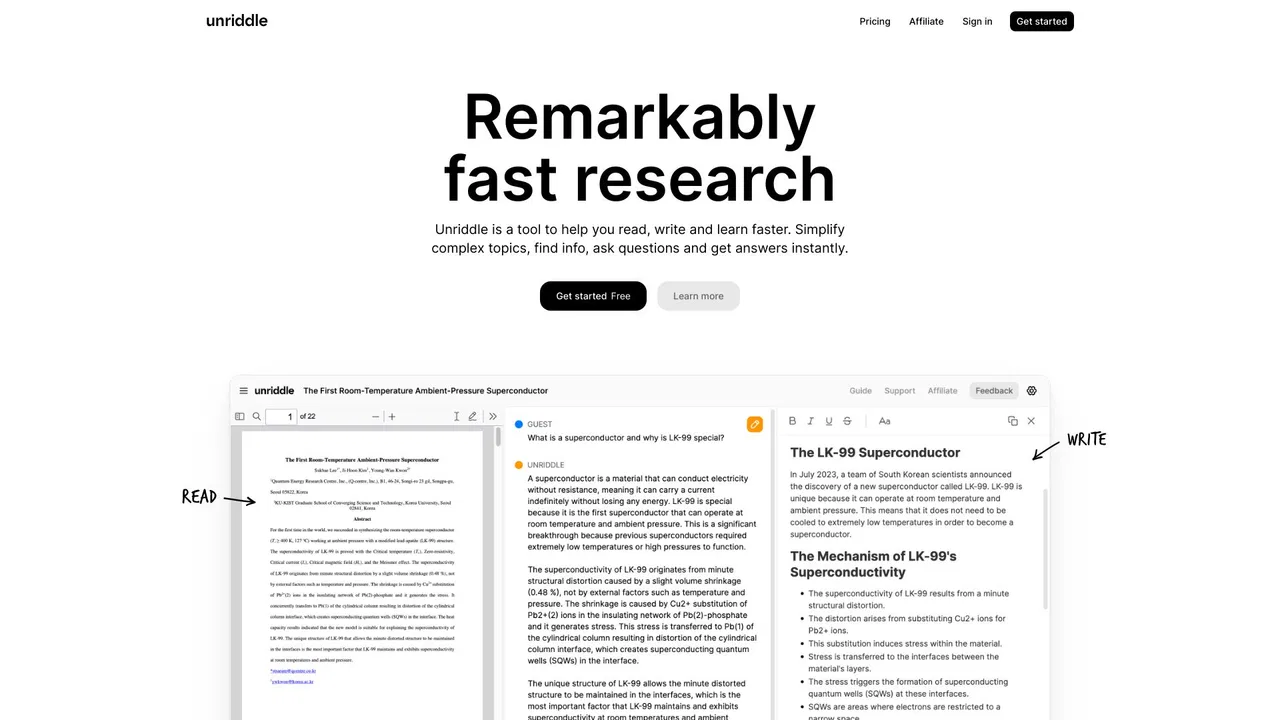
An AI research workspace where every answer points to the exact passage it came from
An AI research workspace where every answer points to the exact passage it came from

AI photo math solver with clear step-by-step solutions

Free AI-assisted birth charts, synastry and forecasts without mandatory sign-up.
Free AI-assisted birth charts, synastry and forecasts without mandatory sign-up.
Build, customise and share S-to-F ranking boards for free
Build, customise and share S-to-F ranking boards for free

Ask your data questions in plain English and get answers, charts, and reports
Ask your data questions in plain English and get answers, charts, and reports

AI video social listening and creator intelligence for social media teams

Turn first-party data into ranked, actionable business decisions
Turn first-party data into ranked, actionable business decisions

Publication-ready scientific figures from a prompt, sketch, abstract, or paper PDF
Publication-ready scientific figures from a prompt, sketch, abstract, or paper PDF

Agentic analytics that turns raw datasets into decision-ready reports in minutes
Agentic analytics that turns raw datasets into decision-ready reports in minutes

Turn research ideas into publication-ready, editable scientific figures
Turn research ideas into publication-ready, editable scientific figures

ChartPixel turns messy spreadsheets, surveys and webpage tables into interactive charts, written insights, forecasts and statistical tests. Upload a file, and the platform cleans and enhances the data, picks the most useful chart types, explains what each one shows, and lets you chat with your data.
ChartPixel turns messy spreadsheets, surveys and webpage tables into interactive charts, written insights, forecasts and statistical tests. Upload a file, and the platform cleans and enhances the data, picks the most useful chart types, explains what each one shows, and lets you chat with your data.

Create technical diagrams in minutes, not hours.
Create technical diagrams in minutes, not hours.

Free browser-based tier list maker with drag-and-drop tiers and one-click PNG export
Free browser-based tier list maker with drag-and-drop tiers and one-click PNG export

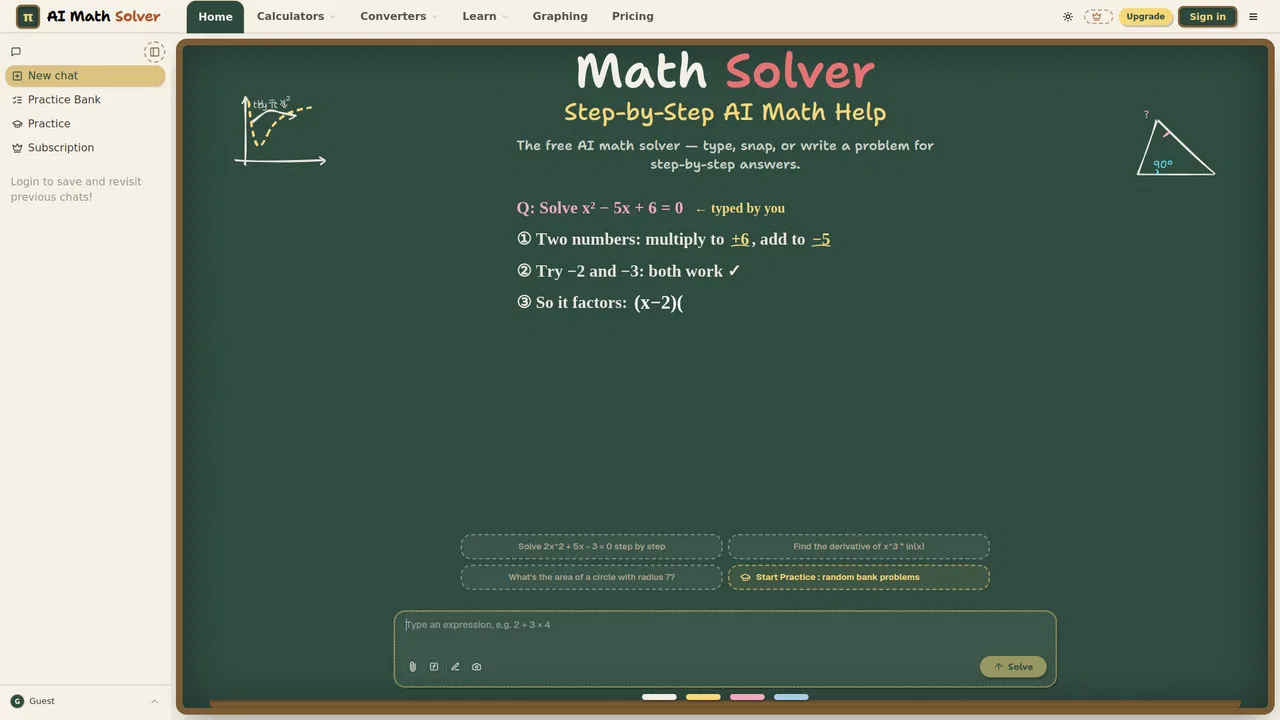
Free AI math solver that shows every step
Free AI math solver that shows every step

AI formulas and agents that run inside Google Sheets
AI formulas and agents that run inside Google Sheets
Rubric-based AI grading and feedback for teachers across essays, math, and science
Rubric-based AI grading and feedback for teachers across essays, math, and science

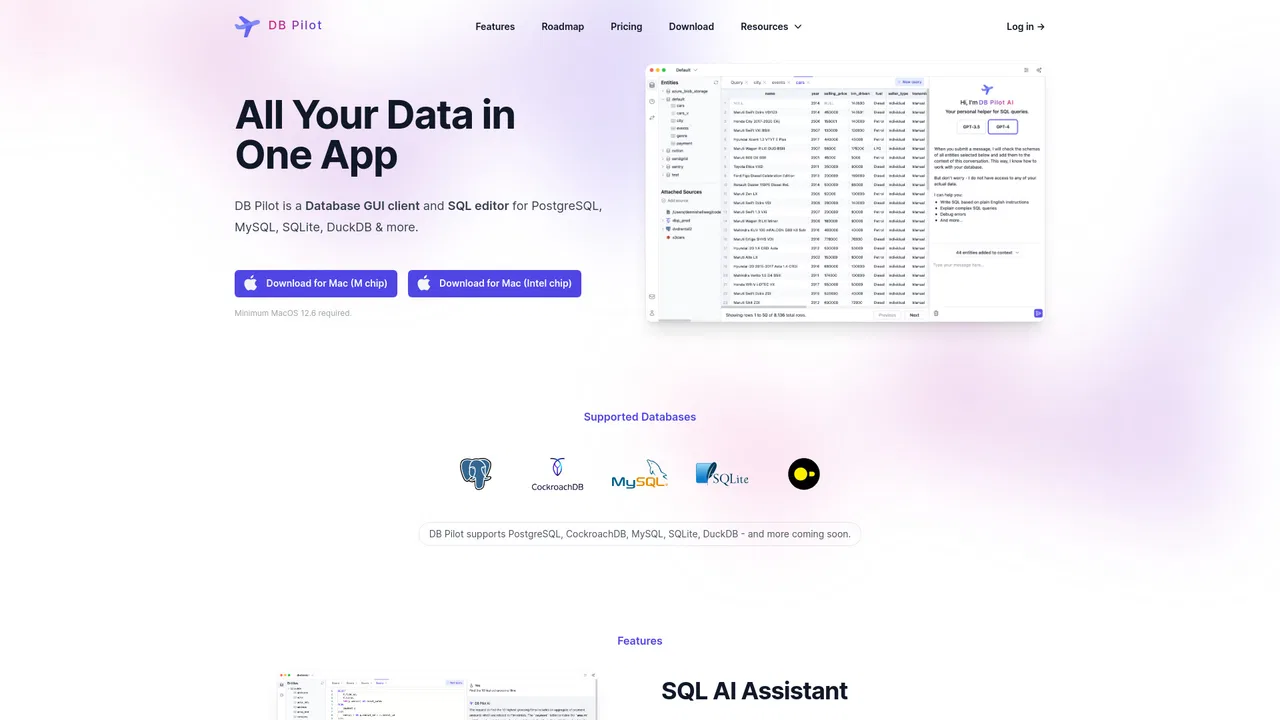
AI-native database GUI, SQL editor and notebooks for Mac
AI-native database GUI, SQL editor and notebooks for Mac

AI math solver and adaptive tutor with a knowledge-graph study path
AI math solver and adaptive tutor with a knowledge-graph study path

AI scientific figure maker for research papers, posters, and grants
AI scientific figure maker for research papers, posters, and grants
Turn raw research content into publication-ready diagrams and plots
Turn raw research content into publication-ready diagrams and plots

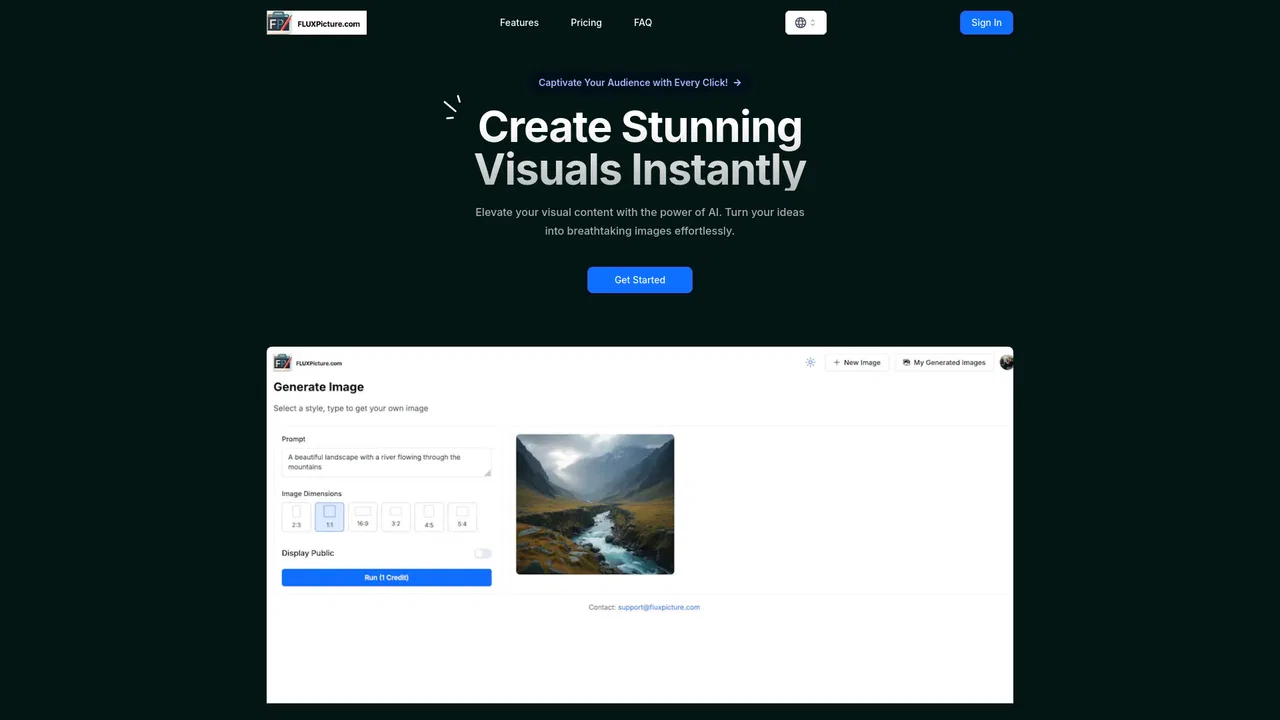
Third-party web access to the FLUX text-to-image model family
Third-party web access to the FLUX text-to-image model family