01
20.4M/mo
Your personal guide to modern astrology
AI ChartingEditorial score: 3.8Free Trial, Paid+15.3%
This view lists 24 of 134 matching AI Charting AI tools. The displayed tools have a combined 21.65M monthly visits; Hint records 20.39M monthly visits.
| Rank | AI Tool | Monthly Visits | MoM Growth | Direct visits | Pricing | Top Market | Rating | Head-to-Head |
|---|---|---|---|---|---|---|---|---|
| 1 | 20.39M | +15.3% | 8% | Free Trial, Paid | 🇺🇸 United States | 3.8 | Alternatives → | |
| 2 | 665.49K | +5% | 40% | Free Trial, Contact for Pricing | 🇮🇳 India | 4.4 | vs Hint | |
| 3 | 151.72K | -11.3% | 13% | Freemium | 🇺🇸 United States | 4.4 | vs Hint | |
| 4 |  | 81.22K | -26.7% | 25% | Freemium | 🇺🇸 United States | 4.3 | vs Hint |
| 5 |  | 75.54K | +12.7% | 43% | Free Trial, Paid, Contact for Pricing | 🇺🇸 United States | 4.3 | vs Hint |
| 6 |  | 46.02K | +519% | 41% | Freemium, Free Trial | 🇺🇸 United States | 4.6 | vs Hint |
| 7 | 45.26K | -27.2% | 40% | Freemium | 🇺🇸 United States | 3.8 | vs Hint | |
| 8 | 38.33K | +26.7% | 40% | Freemium | 🇷🇺 Russia | 4.1 | vs Hint | |
| 9 | 21.91K | -41.7% | 40% | Paid | 🇺🇸 United States | 3.8 | vs Hint | |
| 10 |  | 20.38K | -47.2% | 40% | Freemium | 🇺🇸 United States | 3.8 | vs Hint |
Diagrams from text, code, or a single prompt
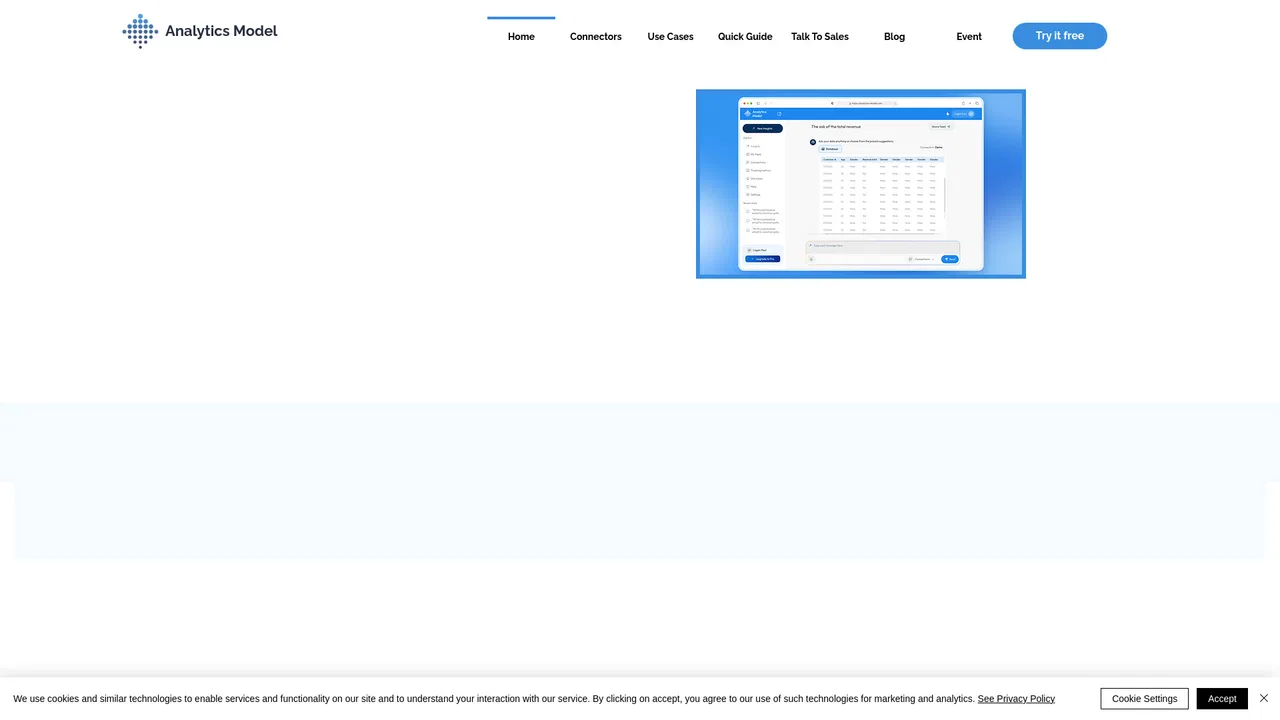
Chat with your data to get analysis, charts, reports, and slides
Your personal guide to modern astrology
Chat with your data to get analysis, charts, reports, and slides
Turn spreadsheet data into custom choropleth maps and interactive embeds
Turn messy data into beautiful, story-ready charts with AI
AI-native business intelligence your whole team can actually trust
Diagrams from text, code, or a single prompt
Describe an animation. Get a Lottie file.
Turn text or data into interactive charts and diagrams with AI
AI trading copilot that reads any chart screenshot in 7 seconds
Chat with your data and get charts and diagrams in seconds
Free BaZi chart calculator with AI-powered Four Pillars readings

Seven AI prediction models for charting and analysing lottery numbers
Generate and edit Mermaid, PlantUML, and Excalidraw diagrams with AI chat

AI analytics for the messy spreadsheets you already have

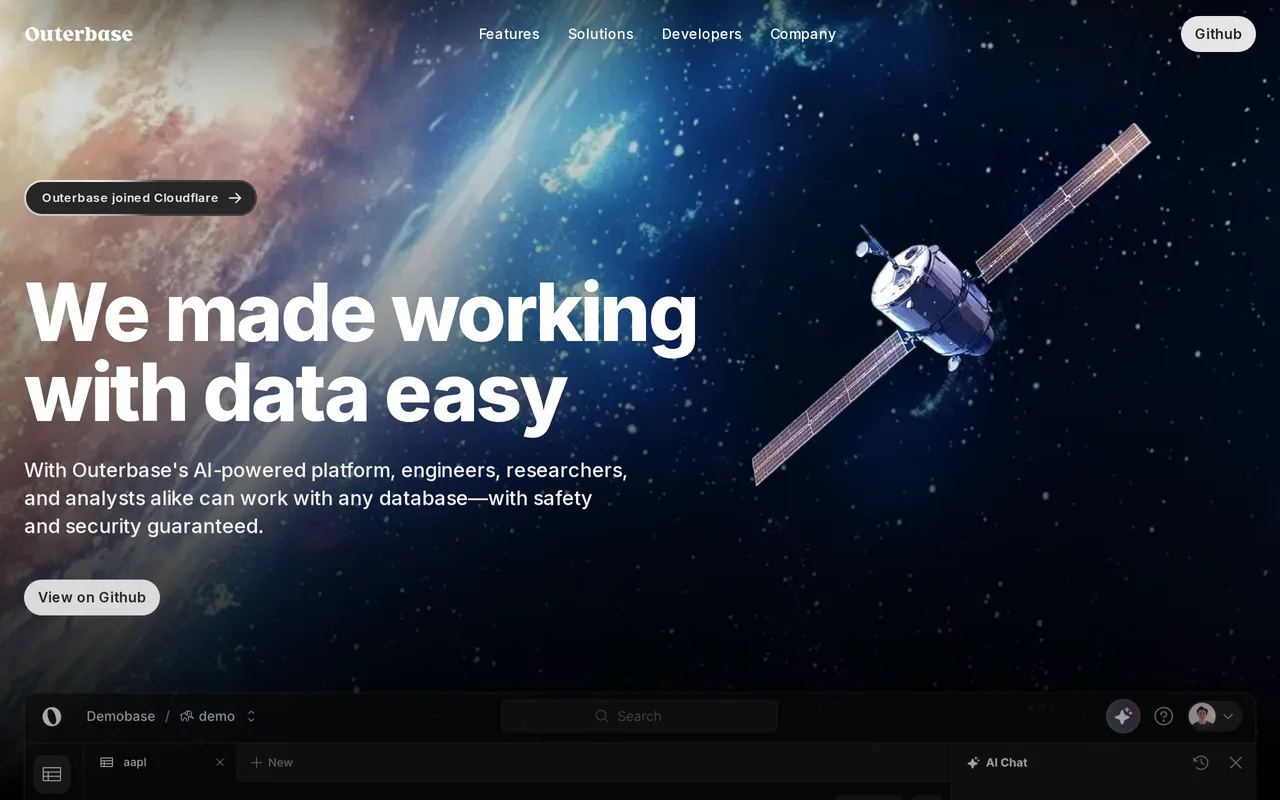
The AI-powered interface for every database you run

Agentic data platform for financial discovery, visualization, and analysis

Turn a paragraph into an editable Gantt chart in about 30 seconds

Turn natural language and data into charts with LLM-driven intelligence


Conversational AI analytics for natural-language data insights

ChartPixel turns messy spreadsheets, surveys and webpage tables into interactive charts, written insights, forecasts and statistical tests. Upload a file, and the platform cleans and enhances the data, picks the most useful chart types, explains what each one shows, and lets you chat with your data.

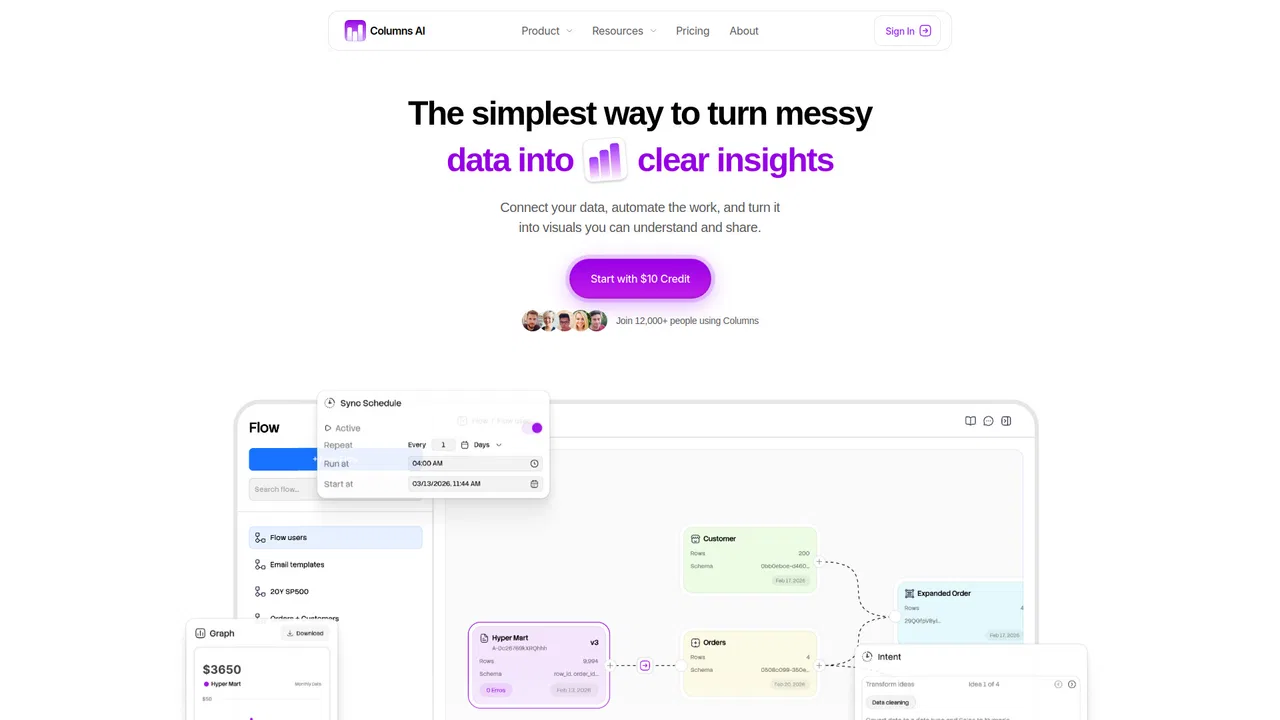
Clean, automate, and visualize your data in one platform

AI trading assistant for chart, news and risk analysis

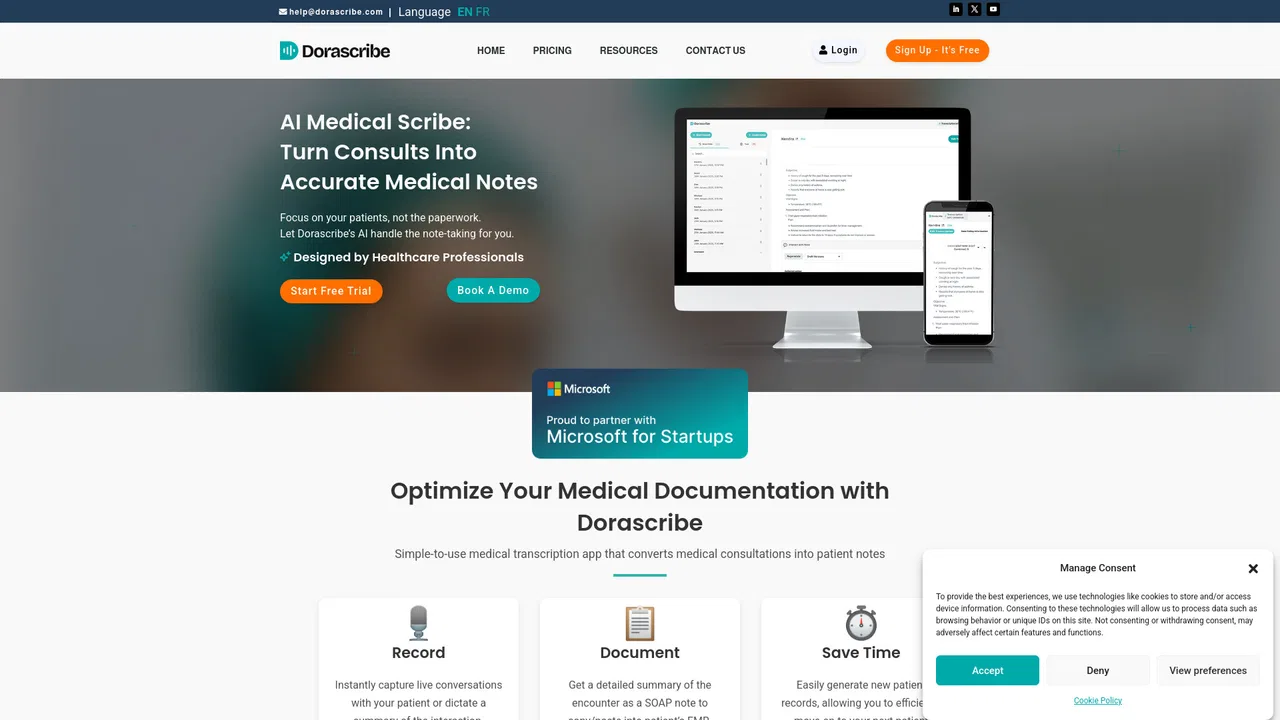
AI medical scribe that turns consultations into EMR-ready clinical notes
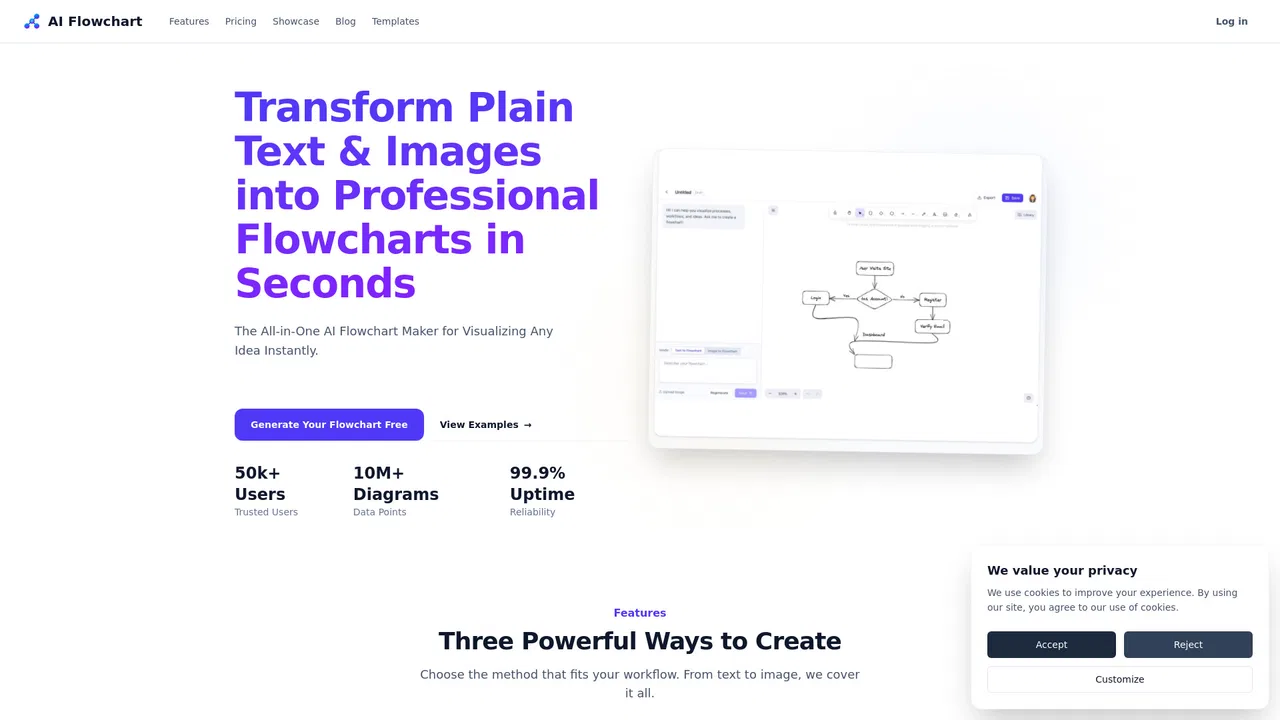
Turn text prompts and images into editable flowcharts in seconds
Diagrams from text, code, or a single prompt
Your personal guide to modern astrology
Chat with your data to get analysis, charts, reports, and slides
Turn spreadsheet data into custom choropleth maps and interactive embeds
AI-native business intelligence your whole team can actually trust
Diagrams from text, code, or a single prompt
Describe an animation. Get a Lottie file.
Turn text or data into interactive charts and diagrams with AI
AI trading copilot that reads any chart screenshot in 7 seconds
Chat with your data and get charts and diagrams in seconds
Free BaZi chart calculator with AI-powered Four Pillars readings
Seven AI prediction models for charting and analysing lottery numbers
Generate and edit Mermaid, PlantUML, and Excalidraw diagrams with AI chat
The AI-powered interface for every database you run
Agentic data platform for financial discovery, visualization, and analysis
Turn a paragraph into an editable Gantt chart in about 30 seconds
Turn natural language and data into charts with LLM-driven intelligence
Conversational AI analytics for natural-language data insights
ChartPixel turns messy spreadsheets, surveys and webpage tables into interactive charts, written insights, forecasts and statistical tests. Upload a file, and the platform cleans and enhances the data, picks the most useful chart types, explains what each one shows, and lets you chat with your data.
Clean, automate, and visualize your data in one platform
AI trading assistant for chart, news and risk analysis
AI medical scribe that turns consultations into EMR-ready clinical notes
Turn text prompts and images into editable flowcharts in seconds