


750.6K/mo
Explore the academic literature as a visual graph of related papers
AI Research ToolEditorial score: 4.7Freemium+3.1%

750.6K/mo+3.1%
Explore the academic literature as a visual graph of related papers
Freemium
Compare AI products across 459 workflows using traffic estimates, features, and alternatives.

“Visualization tool”·717 results
Start overExplore the academic literature as a visual graph of related papers
Explore the academic literature as a visual graph of related papers
Global macro data and AI research platform for smarter economic decisions
Global macro data and AI research platform for smarter economic decisions

Turn plain text into diagrams, infographics, and presentation-ready visuals.

See your future body with AI transformation photos
See your future body with AI transformation photos
Turn paper text into publication-ready academic figures with a multi-agent AI pipeline
Turn paper text into publication-ready academic figures with a multi-agent AI pipeline

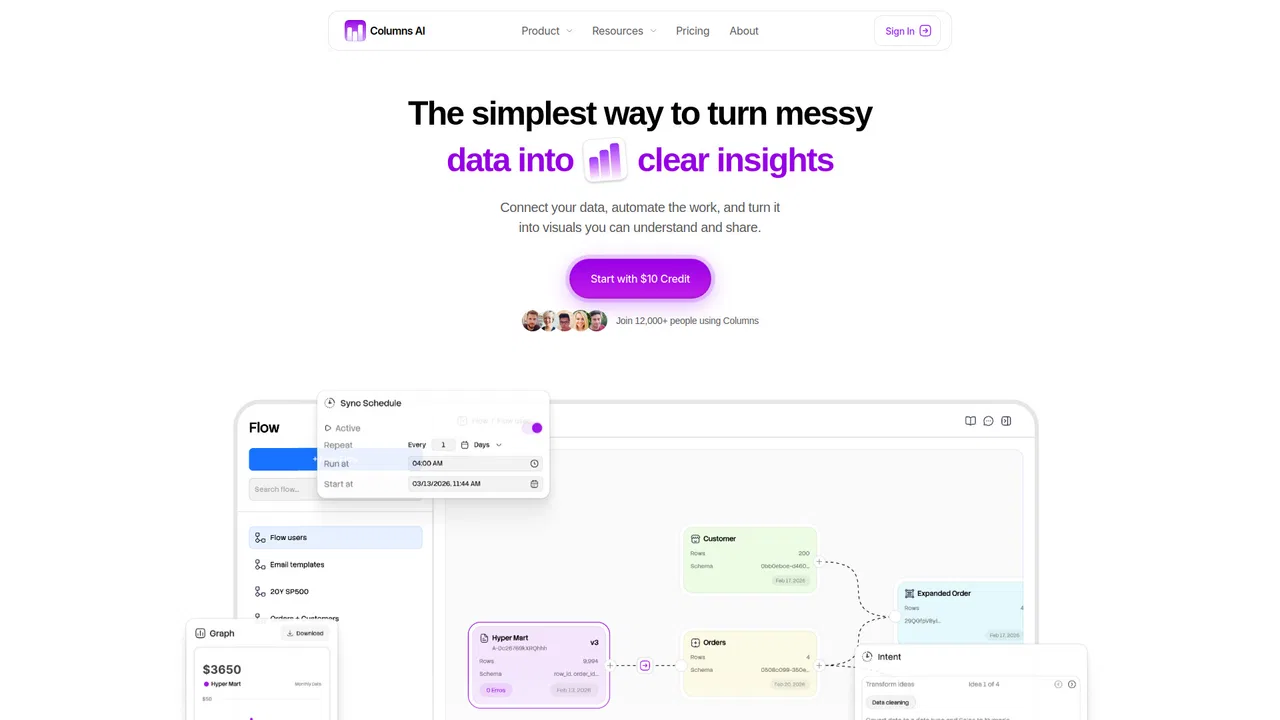
Clean, automate, and visualize your data in one platform
Clean, automate, and visualize your data in one platform

Photorealistic AI renders from your CAD designs in under 10 seconds
Photorealistic AI renders from your CAD designs in under 10 seconds

AI creative suite for videos, logos, images and websites
AI creative suite for videos, logos, images and websites
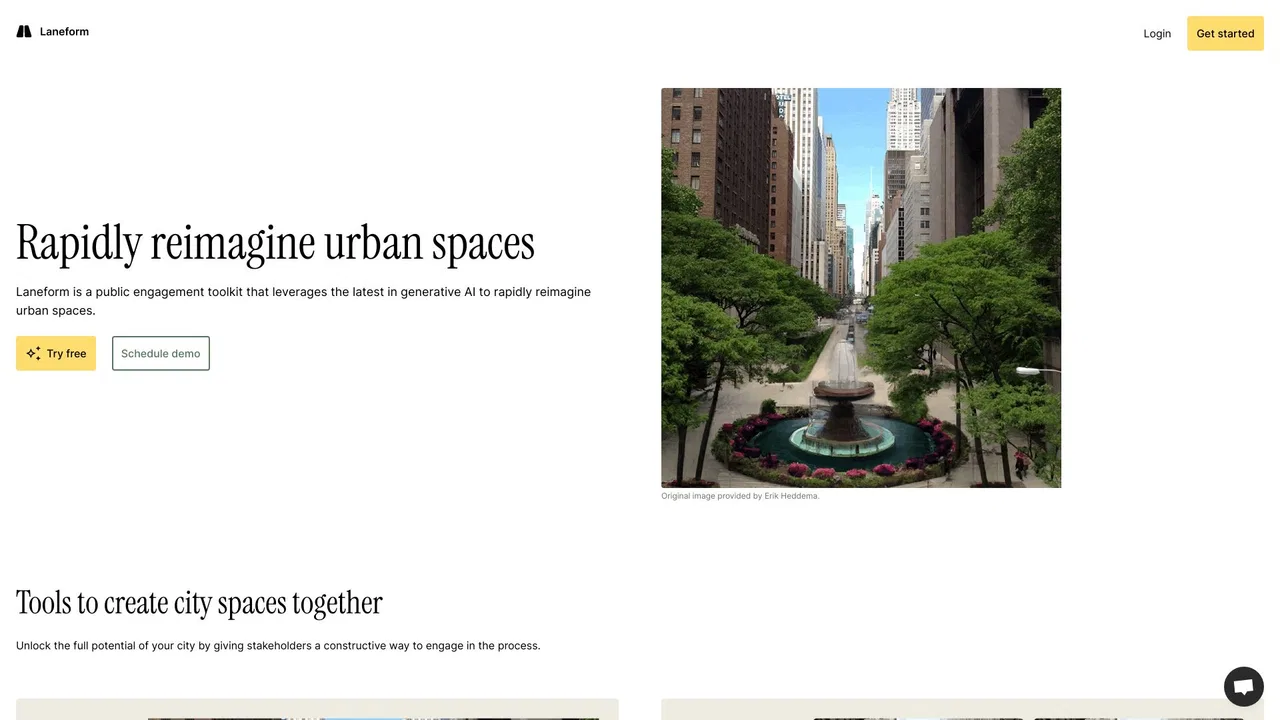
Generative AI toolkit for collecting public feedback on urban design ideas
Generative AI toolkit for collecting public feedback on urban design ideas

AI-powered insights for the world in motion
AI-powered insights for the world in motion

Turn text, URLs and PDFs into polished infographics in seconds
Turn text, URLs and PDFs into polished infographics in seconds

Turn spreadsheets and prompts into AI-powered business apps

A vast library of high-end Photoshop and Figma mockups
A vast library of high-end Photoshop and Figma mockups
Describe your system in words, get a diagram you can edit
Describe your system in words, get a diagram you can edit
Create product mockups from 30,000+ templates, free and watermark-free
Create product mockups from 30,000+ templates, free and watermark-free
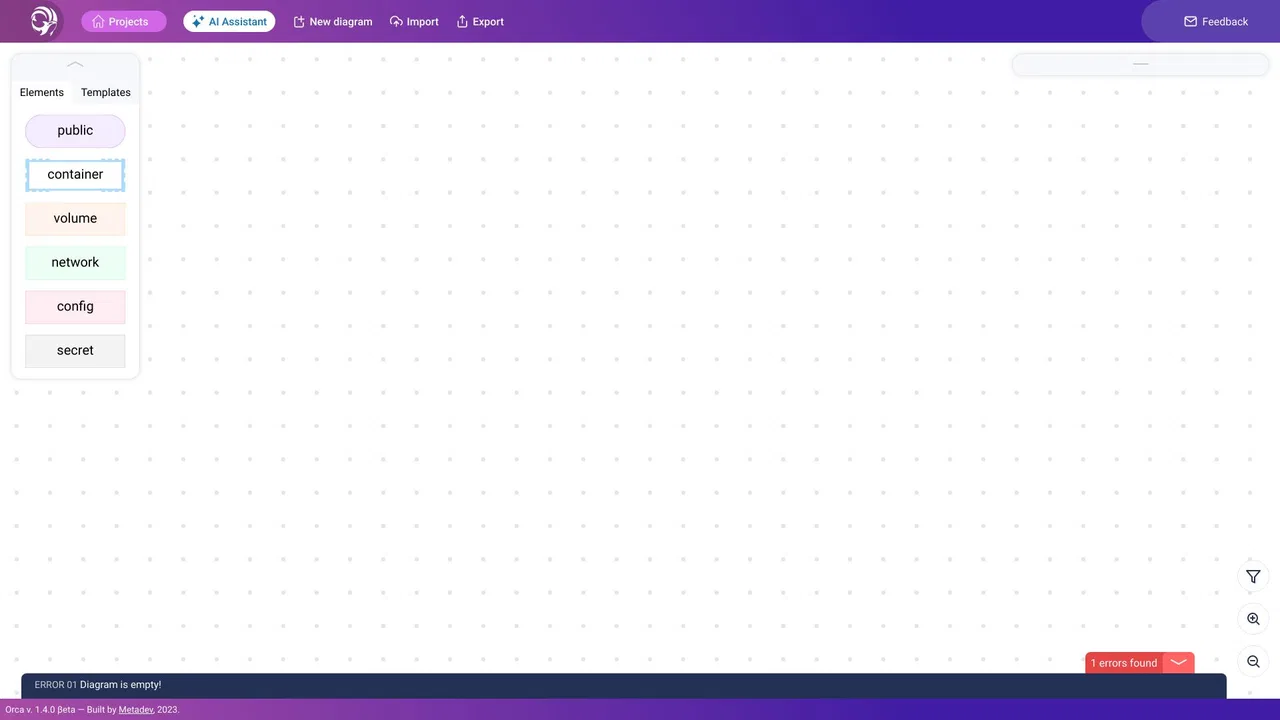
Sketch Docker Compose stacks as diagrams and turn them into working YAML
Sketch Docker Compose stacks as diagrams and turn them into working YAML

One unified platform for 3D optimization, materials, collaboration and delivery
One unified platform for 3D optimization, materials, collaboration and delivery
One privacy-first AI client for GPT, Claude, Gemini and more
One privacy-first AI client for GPT, Claude, Gemini and more

AI architecture platform for instant interior, exterior and 3D renders

AI interior design, floor plans and 3D models for every home project
AI interior design, floor plans and 3D models for every home project

Conversational AI analytics for natural-language data insights
Conversational AI analytics for natural-language data insights

ChartPixel turns messy spreadsheets, surveys and webpage tables into interactive charts, written insights, forecasts and statistical tests. Upload a file, and the platform cleans and enhances the data, picks the most useful chart types, explains what each one shows, and lets you chat with your data.
ChartPixel turns messy spreadsheets, surveys and webpage tables into interactive charts, written insights, forecasts and statistical tests. Upload a file, and the platform cleans and enhances the data, picks the most useful chart types, explains what each one shows, and lets you chat with your data.

Describe it in plain language, get a working web app
Describe it in plain language, get a working web app

Turn plain English, SQL or Terraform into editable draw.io diagrams in seconds
Turn plain English, SQL or Terraform into editable draw.io diagrams in seconds