



4.3editor score
Turn spreadsheet data into charts and infographics with AI
AI SpreadsheetContact for Pricing
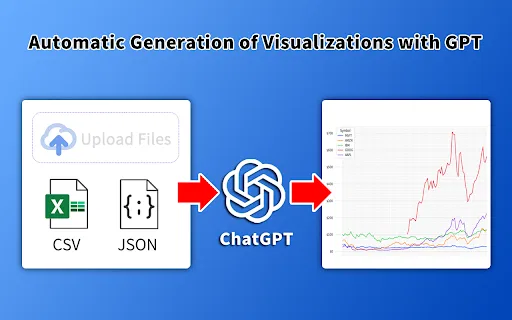
Turn spreadsheet data into charts and infographics with AI
AI SpreadsheetEditorial score: 4.3
Contact for Pricing
Compare AI products across 459 workflows using traffic estimates, features, and alternatives.

“AI-driven code generation”·2,000 results
Start overTurn spreadsheet data into charts and infographics with AI
Turn spreadsheet data into charts and infographics with AI

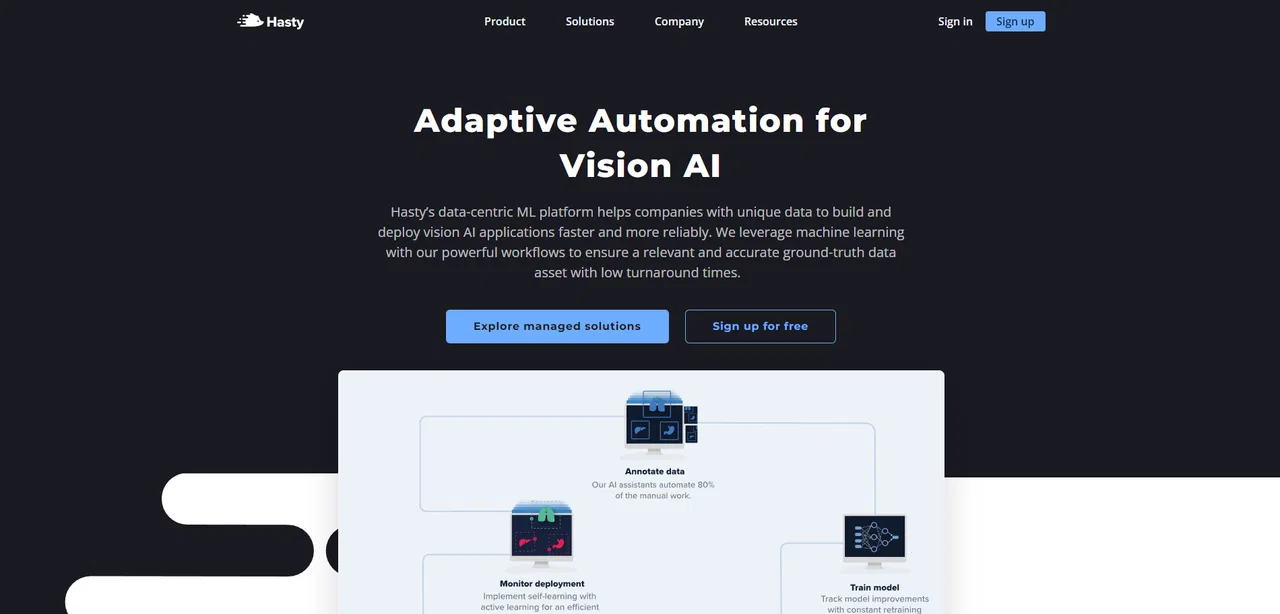
A free, structured wiki for computer vision tasks, models, metrics and deployment
A free, structured wiki for computer vision tasks, models, metrics and deployment

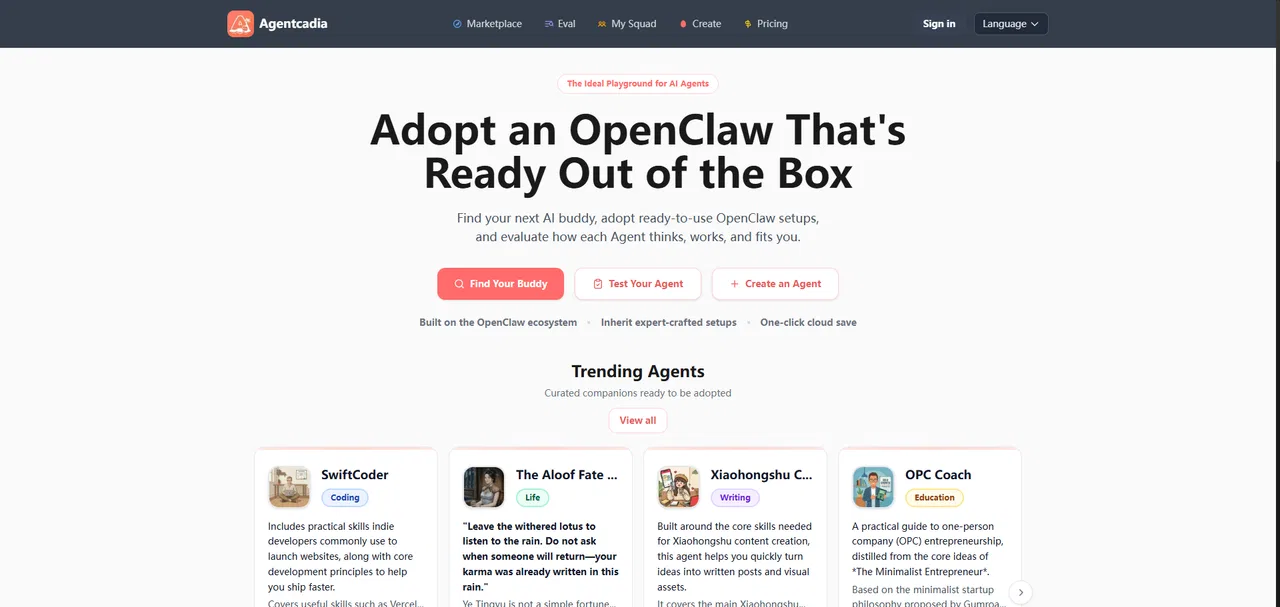
Adopt, evaluate and publish ready-made OpenClaw AI agents

Design and edit SVG graphics by describing them in plain language
Design and edit SVG graphics by describing them in plain language

Local capabilities, reachable anywhere — publish your own apps and agents on the web with permissions you control.
Local capabilities, reachable anywhere — publish your own apps and agents on the web with permissions you control.

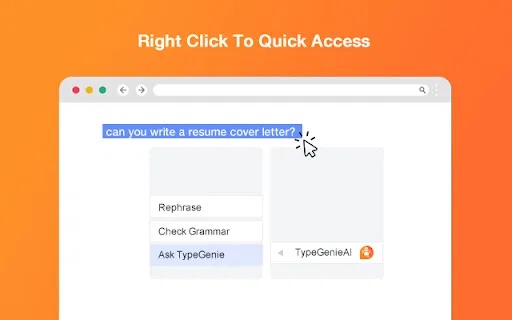
Rephrase, proofread or generate text from the right-click menu of any text box
Rephrase, proofread or generate text from the right-click menu of any text box
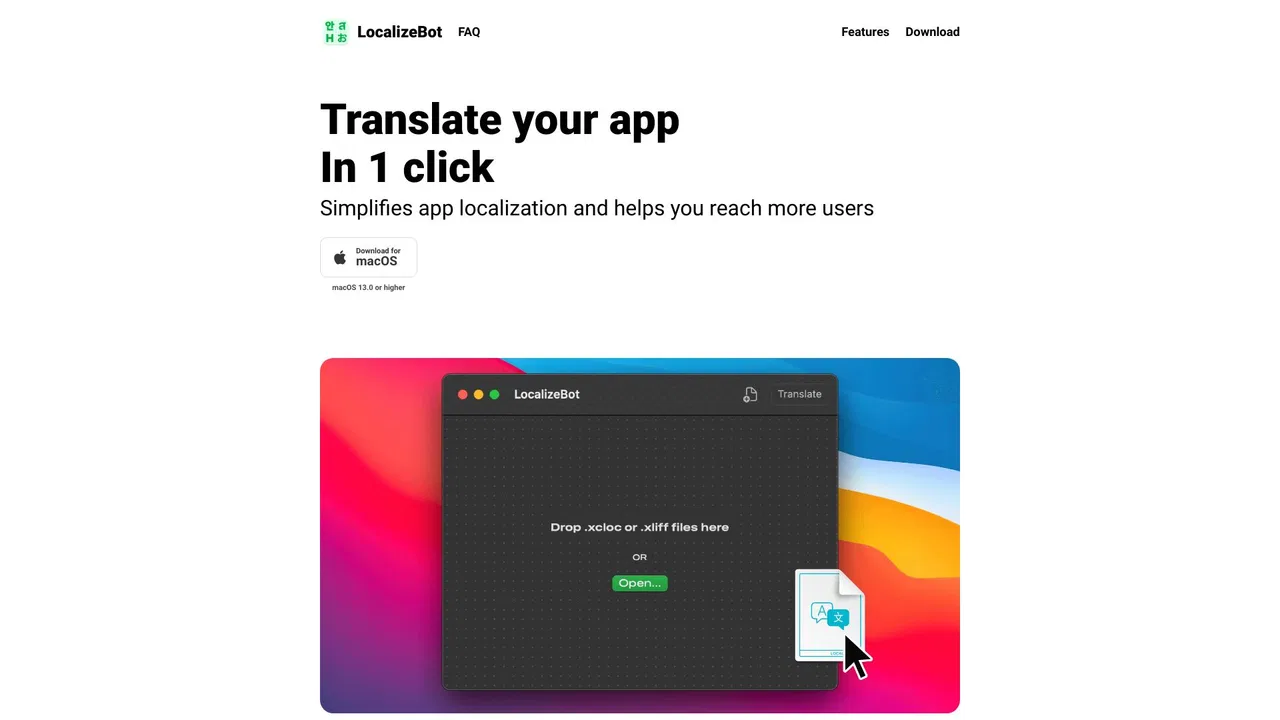
Localize your iOS and macOS apps in one click

A product design studio crafting elegant, human-centered digital experiences for apps and AI products.
A product design studio crafting elegant, human-centered digital experiences for apps and AI products.