01
20,4 Mio./Monat
Ihr persönlicher Wegweiser in der modernen Astrologie
KI-Diagramme und ChartsRedaktionswert: 3.8Kostenlose Testversion, Kostenpflichtig+15,3 %
Diese Ansicht listet 24 von 134 passenden KI-Diagramme und Charts-KI-Tools. Die angezeigten Tools haben zusammen 21,65 Mio. monatliche Besuche; Hint verzeichnet 20,39 Mio. monatliche Besuche.
Ihr persönlicher Wegweiser in der modernen Astrologie
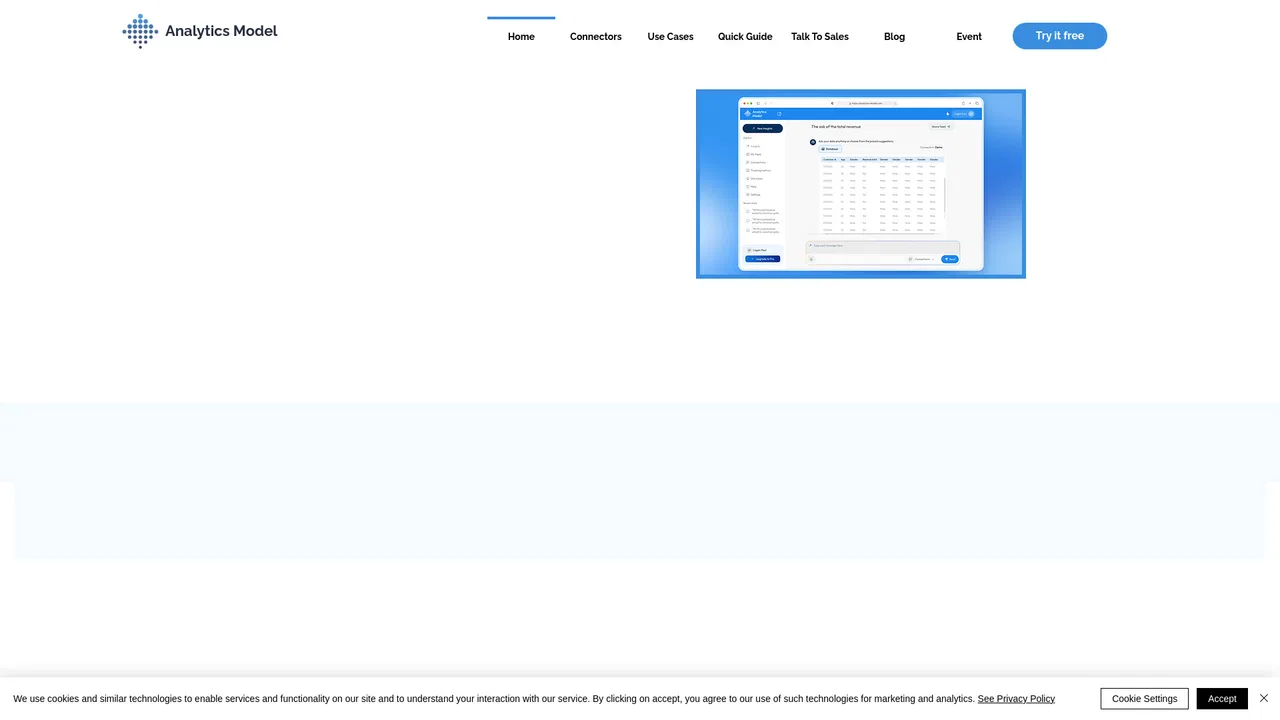
Mit Ihren Daten sprechen und Analyse, Diagramme, Berichte und Folien erhalten
Ultimaps is a browser-based map maker that turns spreadsheet data into styled visualizations. Pick from hundreds of pre-built maps of the world, countries, US states, counties or ZIP codes, then color regions manually or import from Excel, CSV, Google Sheets or Notion. It builds color scales and legends automatically, supports pins from addresses, and exports PNG, SVG or PDF or publishes an embeddable interactive map.

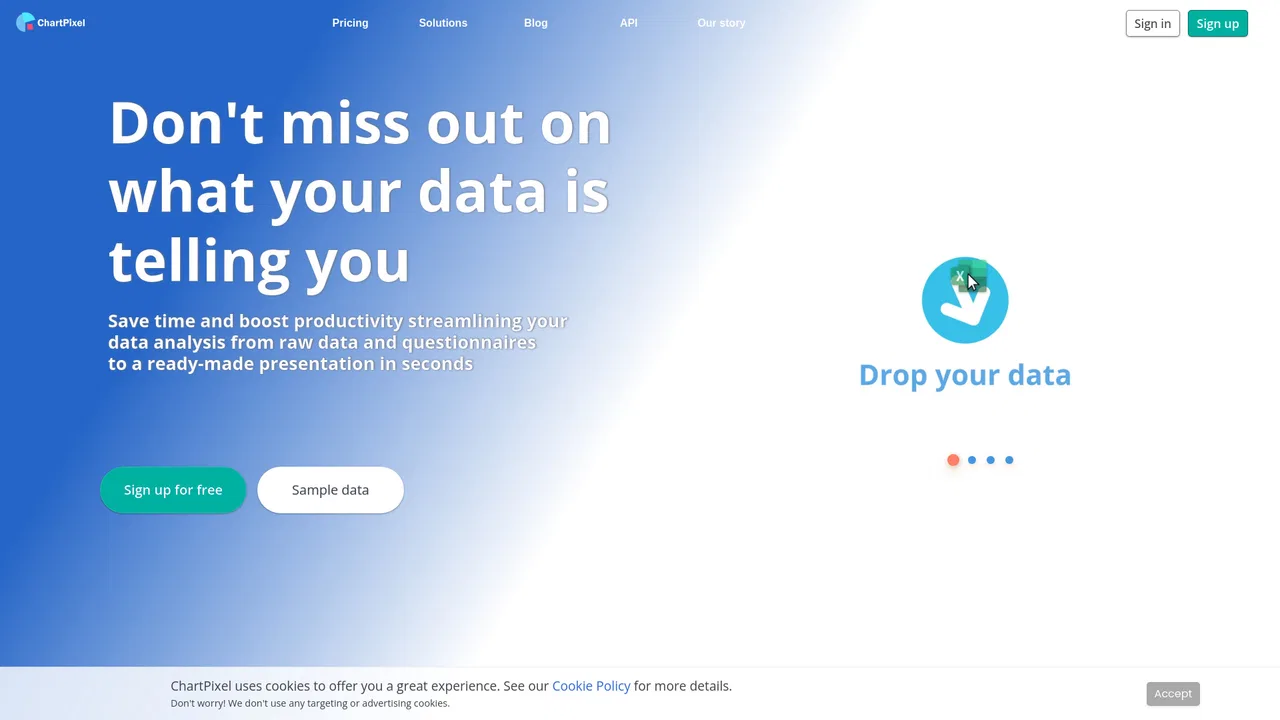
Unordentliche Daten in schöne, erzählbare Diagramme verwandeln

KI-native Business Intelligence, der das ganze Team vertrauen kann

Diagramme aus Text, Code oder einer einzigen Eingabe
vizGPT is a browser-based AI animation and graphics generator. Describe an animation in plain language and it produces a Lottie JSON file, animated SVG motion graphic or infographic that you can refine through chat and export for web, iOS and Android — alongside AI image and video generation and a data-analysis chat agent.
Text oder Daten mit KI in interaktive Diagramme und Grafiken verwandeln
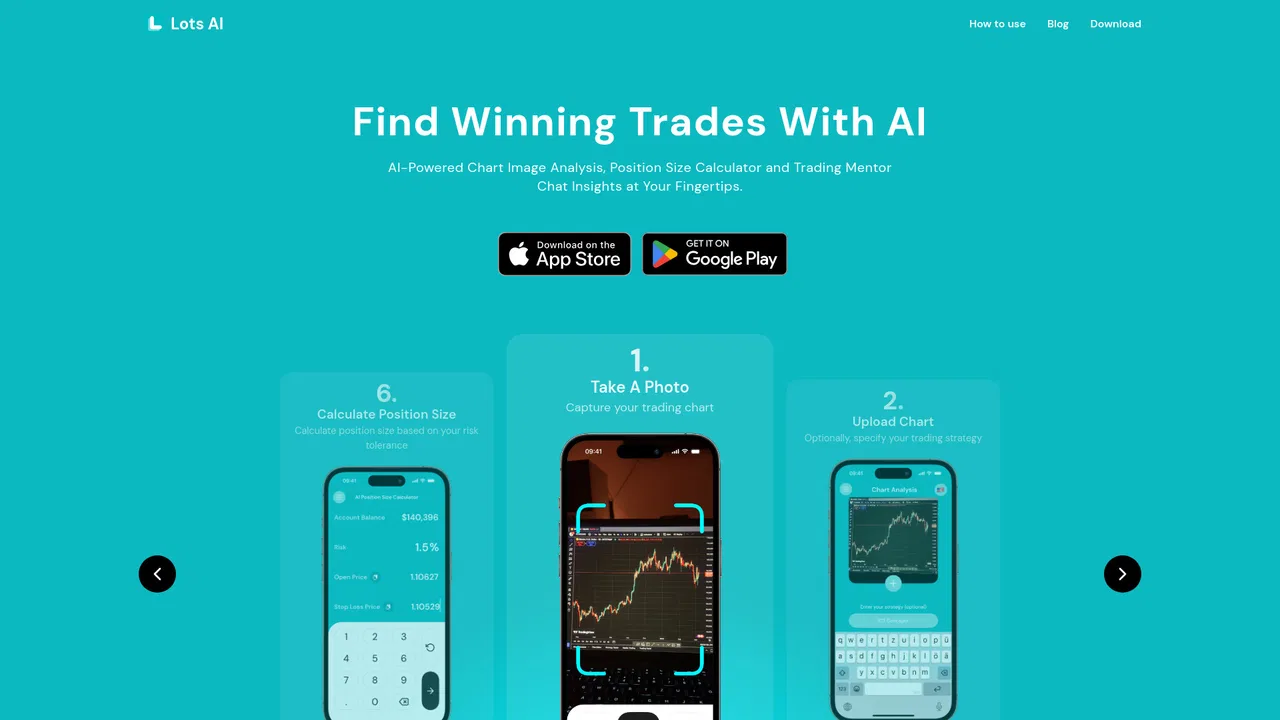
KI-Trading-Copilot, der jeden Chart in 7 Sekunden liest

Diagramme und Charts in Sekunden per Chat erstellen
ShenShu AI generates your BaZi (Four Pillars of Destiny) chart for free and then explains it with an AI reading covering career, wealth and relationships. It also offers follow-up AI questions, compatibility charts and a 10-year luck cycle calculator.

Sieben KI-Prognosemodelle zum Charting und Analysieren von Lotteriezahlen
Mermaid-, PlantUML- und Excalidraw-Diagramme per KI-Chat erstellen und bearbeiten

KI-Analyse für die unordentlichen Tabellen, die Sie bereits haben

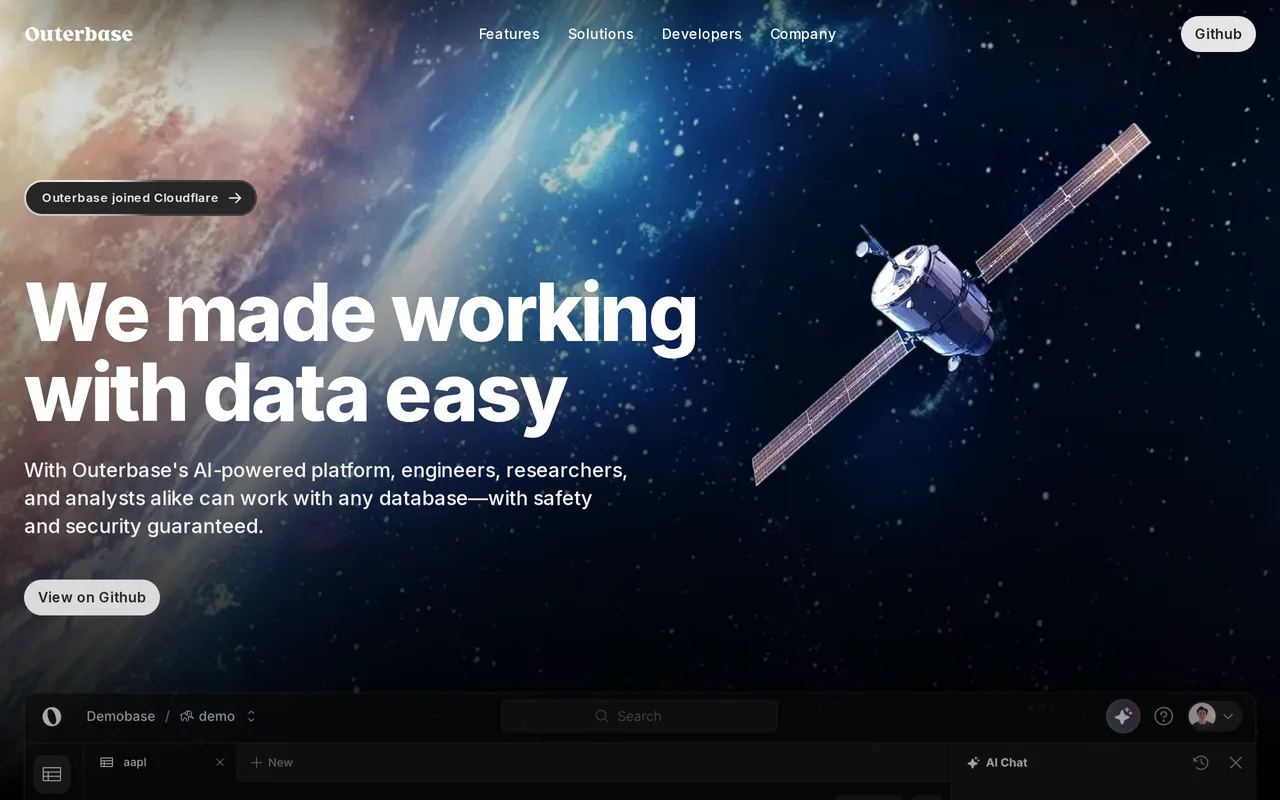
Outerbase is an AI-native workspace for exploring, querying and visualizing data across SQL and NoSQL databases. It pairs an ask-in-plain-English assistant with a spreadsheet-style table editor, dashboards and a shared data catalog, so engineers and analysts can work on the same data without fighting tooling. As of 2025 the team has joined Cloudflare.

Rose AI is a cloud data platform built for finance teams that unifies data discovery, visualization, and analysis in one workspace. It ships with an agentic engine, 50+ million time series from 30+ vendors, and natural-language query tools so analysts can move from a question to a traceable, explainable insight without stitching together separate tools.

Aus einem Absatz in rund 30 Sekunden ein bearbeitbares Gantt-Diagramm

VMind is the intelligent visualization module in the VisActor suite. Given a dataset and a natural-language request, its LLM-driven engine recommends a chart type, maps the data to the right fields, and generates runnable VChart specs — turning conversational intent into production-ready visualizations.

Konversationelle KI-Analytik für Erkenntnisse in natürlicher Sprache

KI-Datenanalyse und Diagramme für alle

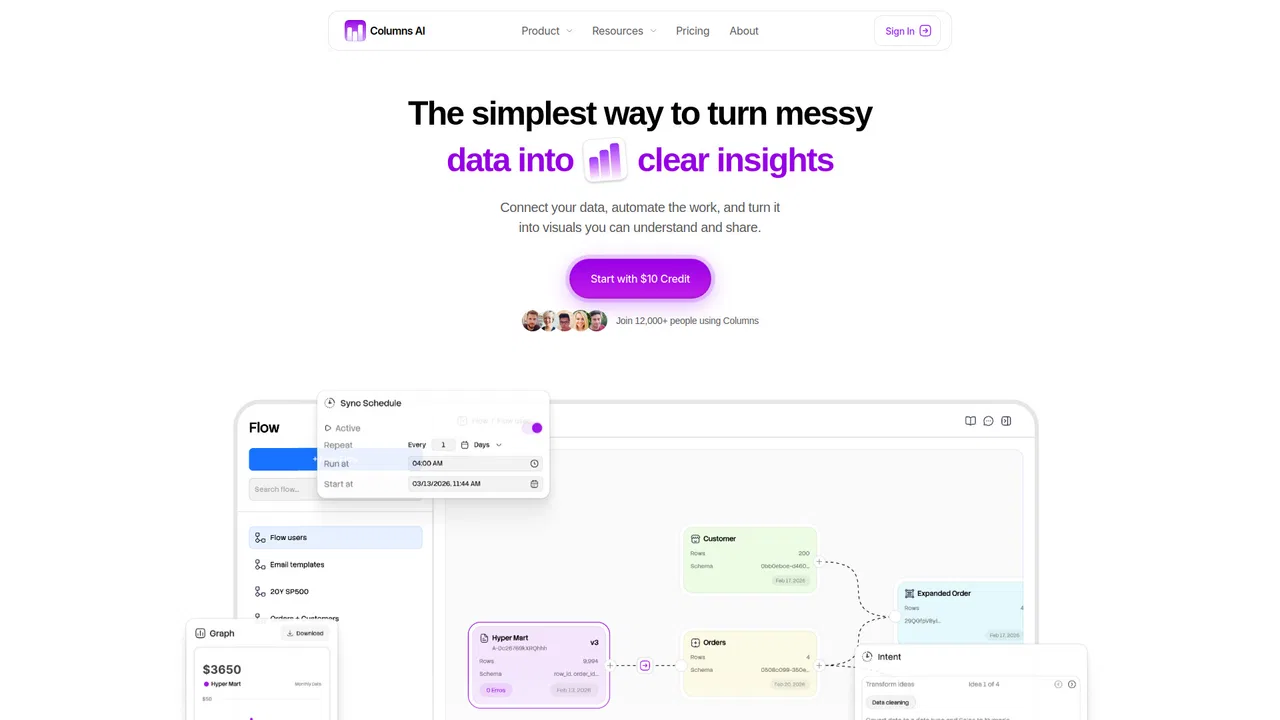
Daten bereinigen, automatisieren und visualisieren in einer Plattform

KI-Trading-Assistent für Chart-, News- und Risikoanalyse

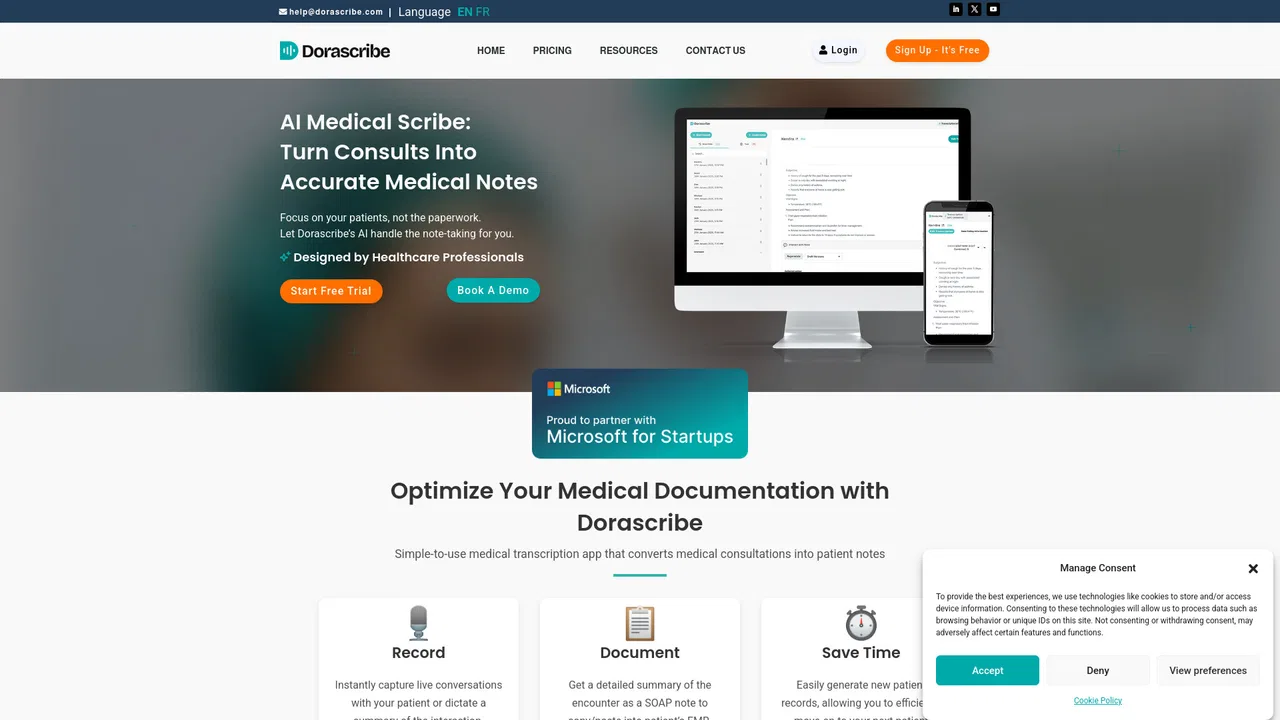
KI-Medizinschreiber, der Konsultationen in EMR-fähige klinische Notizen verwandelt
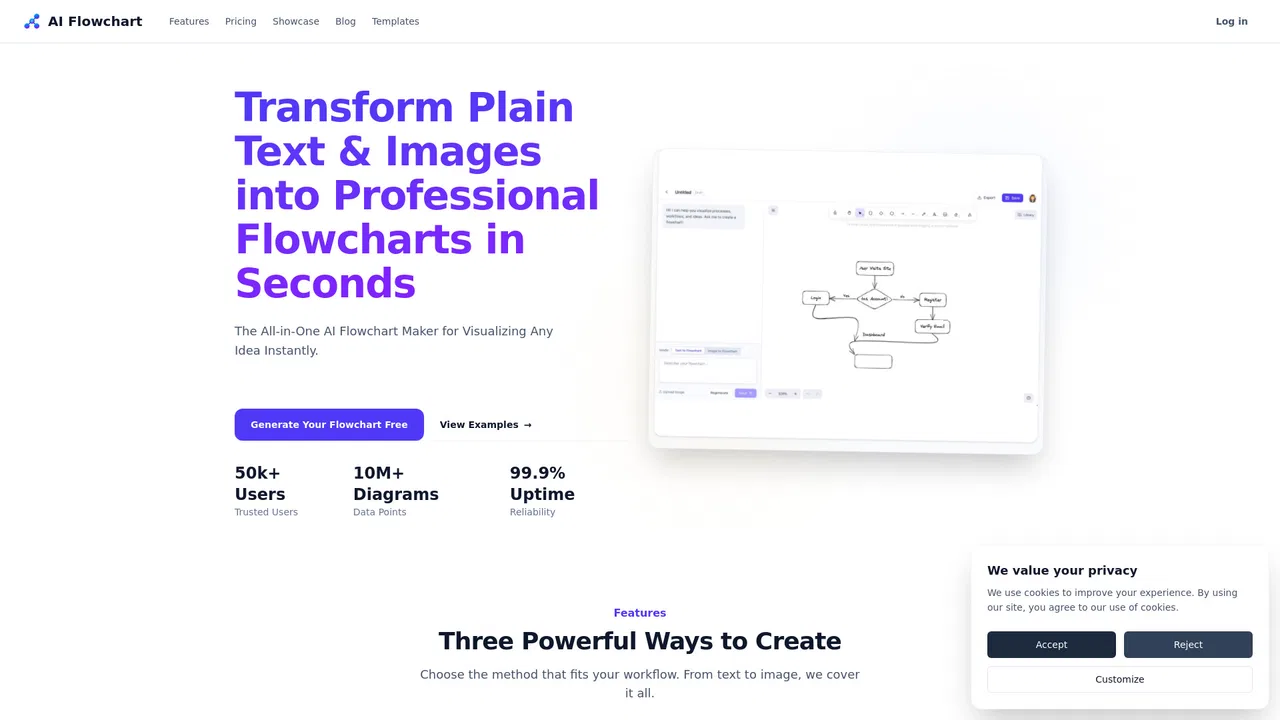
Text und Bilder in Sekunden in bearbeitbare Flussdiagramme verwandeln
| Rang | KI-Tool | Monatliche Besuche | MoM-Wachstum | Direkte Besuche | Preise | Top-Markt | Bewertung | Direktvergleich |
|---|---|---|---|---|---|---|---|---|
| 1 | 20,39 Mio. | +15,3 % | 8% | Kostenlose Testversion, Kostenpflichtig | 🇺🇸 Vereinigte Staaten | 3,8 | Alternativen → | |
| 2 | 665.487 | +5 % | 40% | Kostenlose Testversion, Preise auf Anfrage | 🇮🇳 Indien | 4,4 | vs Hint | |
| 3 | 151.723 | -11,3 % | 13% | Freemium | 🇺🇸 Vereinigte Staaten | 4,4 | vs Hint | |
| 4 | | 81.219 | -26,7 % | 25% | Freemium | 🇺🇸 Vereinigte Staaten | 4,3 | vs Hint |
| 5 | | 75.536 | +12,7 % | 43% | Kostenlose Testversion, Kostenpflichtig, Preise auf Anfrage | 🇺🇸 Vereinigte Staaten | 4,3 | vs Hint |
| 6 | | 46.022 | +519 % | 41% | Freemium, Kostenlose Testversion | 🇺🇸 Vereinigte Staaten | 4,6 | vs Hint |
| 7 | 45.262 | -27,2 % | 40% | Freemium | 🇺🇸 Vereinigte Staaten | 3,8 | vs Hint | |
| 8 | 38.331 | +26,7 % | 40% | Freemium | 🇷🇺 Russland | 4,1 | vs Hint | |
| 9 | 21.911 | -41,7 % | 40% | Kostenpflichtig | 🇺🇸 Vereinigte Staaten | 3,8 | vs Hint | |
| 10 | | 20.381 | -47,2 % | 40% | Freemium | 🇺🇸 Vereinigte Staaten | 3,8 | vs Hint |
Ihr persönlicher Wegweiser in der modernen Astrologie
Diagramme aus Text, Code oder einer einzigen Eingabe
Mit Ihren Daten sprechen und Analyse, Diagramme, Berichte und Folien erhalten
Ihr persönlicher Wegweiser in der modernen Astrologie
Diagramme aus Text, Code oder einer einzigen Eingabe
Ihr persönlicher Wegweiser in der modernen Astrologie
Mit Ihren Daten sprechen und Analyse, Diagramme, Berichte und Folien erhalten
Ultimaps is a browser-based map maker that turns spreadsheet data into styled visualizations. Pick from hundreds of pre-built maps of the world, countries, US states, counties or ZIP codes, then color regions manually or import from Excel, CSV, Google Sheets or Notion. It builds color scales and legends automatically, supports pins from addresses, and exports PNG, SVG or PDF or publishes an embeddable interactive map.
KI-native Business Intelligence, der das ganze Team vertrauen kann
Diagramme aus Text, Code oder einer einzigen Eingabe
vizGPT is a browser-based AI animation and graphics generator. Describe an animation in plain language and it produces a Lottie JSON file, animated SVG motion graphic or infographic that you can refine through chat and export for web, iOS and Android — alongside AI image and video generation and a data-analysis chat agent.
Text oder Daten mit KI in interaktive Diagramme und Grafiken verwandeln
KI-Trading-Copilot, der jeden Chart in 7 Sekunden liest
Diagramme und Charts in Sekunden per Chat erstellen
ShenShu AI generates your BaZi (Four Pillars of Destiny) chart for free and then explains it with an AI reading covering career, wealth and relationships. It also offers follow-up AI questions, compatibility charts and a 10-year luck cycle calculator.
Sieben KI-Prognosemodelle zum Charting und Analysieren von Lotteriezahlen
Mermaid-, PlantUML- und Excalidraw-Diagramme per KI-Chat erstellen und bearbeiten
Outerbase is an AI-native workspace for exploring, querying and visualizing data across SQL and NoSQL databases. It pairs an ask-in-plain-English assistant with a spreadsheet-style table editor, dashboards and a shared data catalog, so engineers and analysts can work on the same data without fighting tooling. As of 2025 the team has joined Cloudflare.
Rose AI is a cloud data platform built for finance teams that unifies data discovery, visualization, and analysis in one workspace. It ships with an agentic engine, 50+ million time series from 30+ vendors, and natural-language query tools so analysts can move from a question to a traceable, explainable insight without stitching together separate tools.
Aus einem Absatz in rund 30 Sekunden ein bearbeitbares Gantt-Diagramm
VMind is the intelligent visualization module in the VisActor suite. Given a dataset and a natural-language request, its LLM-driven engine recommends a chart type, maps the data to the right fields, and generates runnable VChart specs — turning conversational intent into production-ready visualizations.
Konversationelle KI-Analytik für Erkenntnisse in natürlicher Sprache
KI-Datenanalyse und Diagramme für alle
Daten bereinigen, automatisieren und visualisieren in einer Plattform
KI-Trading-Assistent für Chart-, News- und Risikoanalyse
KI-Medizinschreiber, der Konsultationen in EMR-fähige klinische Notizen verwandelt
Text und Bilder in Sekunden in bearbeitbare Flussdiagramme verwandeln