
Mit Ihren Daten sprechen und Analyse, Diagramme, Berichte und Folien erhalten
Vergleiche KI-Produkte für 459 Workflows anhand von Traffic-Schätzungen, Funktionen und Alternativen.
“Data visualization”·628 Ergebnisse
Neu startenMit Ihren Daten sprechen und Analyse, Diagramme, Berichte und Folien erhalten
Mit Ihren Daten sprechen und Analyse, Diagramme, Berichte und Folien erhalten

Rerun is an open-source SDK and visualizer for multimodal, multi-rate data, positioned as the data layer for physical AI. Using Python, Rust, or C++ APIs, developers can log robotics, computer vision, and sensor data and review it in a viewer that handles time series and 3D together.

Text und Daten mit KI in ansprechende Infografiken, Berichte und Videos verwandeln
Ultimaps is a browser-based map maker that turns spreadsheet data into styled visualizations. Pick from hundreds of pre-built maps of the world, countries, US states, counties or ZIP codes, then color regions manually or import from Excel, CSV, Google Sheets or Notion. It builds color scales and legends automatically, supports pins from addresses, and exports PNG, SVG or PDF or publishes an embeddable interactive map.

Diagramme und Charts in Sekunden per Chat erstellen
Globale Makrodaten und KI-Rechercheplattform für bessere Wirtschaftsentscheidungen

Voxel51 is the data platform for physical AI, built on the open-source FiftyOne library. It helps computer vision and robotics teams search, visualize, curate, annotate, and evaluate multimodal datasets — images, video, 3D scenes, and sensor streams — so they can find where models fail and fix the data behind them.

Unordentliche Daten in schöne, erzählbare Diagramme verwandeln

Napkin AI is a visual communication platform that turns plain text into diagrams, infographics, flowcharts, mind maps, data charts, and full presentation decks — no prompt engineering required.

SciDraw AI turns a text description, a rough sketch or a CSV file into publication-ready scientific illustrations and journal-styled charts, exporting fully editable SVG and PPTX vector files instead of flat images.

TradesViz is a feature-dense online trading journal that works across stocks, options, futures, forex, crypto and event contracts. It auto-syncs trades from hundreds of brokers, computes 600+ statistics and interactive charts, and layers an AI suite on top — including an AI Coach that reviews your trades, an AI Query tool that answers questions about your data in plain English, and a hosted MCP connection so ChatGPT or Claude can read your journal.

KI-native Business Intelligence, der das ganze Team vertrauen kann

Interaktive Kurse für Data Science, KI und Analytics

Tabellen, Berichte und Präsentationen im Dialog bearbeiten

KI-Textanalyse mit Wissensgraphen zur Aufdeckung von Themen und Lücken

Stellen Sie Fragen an Ihre Daten in natürlicher Sprache und erhalten Sie Antworten, Diagramme und Berichte
WolframAlpha is a computational knowledge engine that answers factual, mathematical, and scientific queries by computing results from curated data and algorithms rather than just searching for them.

Kostenlose visuelle Analyse von Finanzberichten
vizGPT is a browser-based AI animation and graphics generator. Describe an animation in plain language and it produces a Lottie JSON file, animated SVG motion graphic or infographic that you can refine through chat and export for web, iOS and Android — alongside AI image and video generation and a data-analysis chat agent.

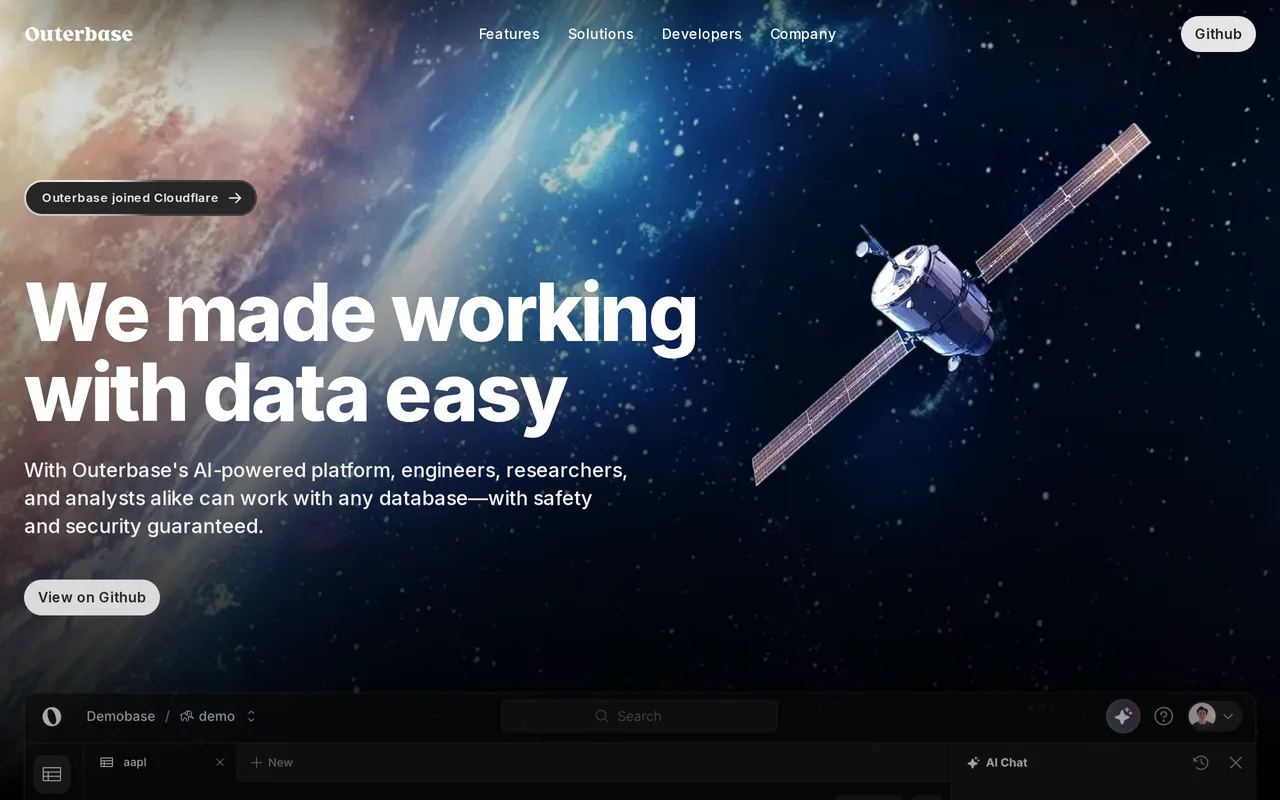
Outerbase is an AI-native workspace for exploring, querying and visualizing data across SQL and NoSQL databases. It pairs an ask-in-plain-English assistant with a spreadsheet-style table editor, dashboards and a shared data catalog, so engineers and analysts can work on the same data without fighting tooling. As of 2025 the team has joined Cloudflare.
KI-gestützte White-Label-Analytics und Datenfreigabe in Ihr Produkt einbetten

Open-Source-Datenbankdiagramm-Editor mit KI-generierten ER-Diagrammen

PageOn.AI is an AI presentation and infographic maker. Describe a topic, paste a link or point at a video, and AI agents research it, plan the structure and design interactive pages with charts, media, maps and animated graphics instead of static slides.

Rose AI is a cloud data platform built for finance teams that unifies data discovery, visualization, and analysis in one workspace. It ships with an agentic engine, 50+ million time series from 30+ vendors, and natural-language query tools so analysts can move from a question to a traceable, explainable insight without stitching together separate tools.