01
20,4 M/mois
Votre guide personnel vers l'astrologie moderne
Graphiques par IANote de la rédaction : 3.8Essai gratuit, Payant+15,3 %
Cette vue répertorie 24 des 134 outils d'IA Graphiques par IA correspondants. Les outils affichés totalisent 21,65 M visites mensuelles ; Hint enregistre 20,39 M visites mensuelles.
Votre guide personnel vers l'astrologie moderne
Dialoguez avec vos données pour obtenir analyse, graphiques, rapports et diaporamas
Ultimaps is a browser-based map maker that turns spreadsheet data into styled visualizations. Pick from hundreds of pre-built maps of the world, countries, US states, counties or ZIP codes, then color regions manually or import from Excel, CSV, Google Sheets or Notion. It builds color scales and legends automatically, supports pins from addresses, and exports PNG, SVG or PDF or publishes an embeddable interactive map.

Transformez des données brutes en graphiques élégants prêts à raconter

Une business intelligence native IA à laquelle toute l'équipe peut se fier

Des diagrammes à partir de texte, de code ou d'une simple consigne
vizGPT is a browser-based AI animation and graphics generator. Describe an animation in plain language and it produces a Lottie JSON file, animated SVG motion graphic or infographic that you can refine through chat and export for web, iOS and Android — alongside AI image and video generation and a data-analysis chat agent.
Transformez un texte ou des données en graphiques et schémas interactifs grâce à l'IA
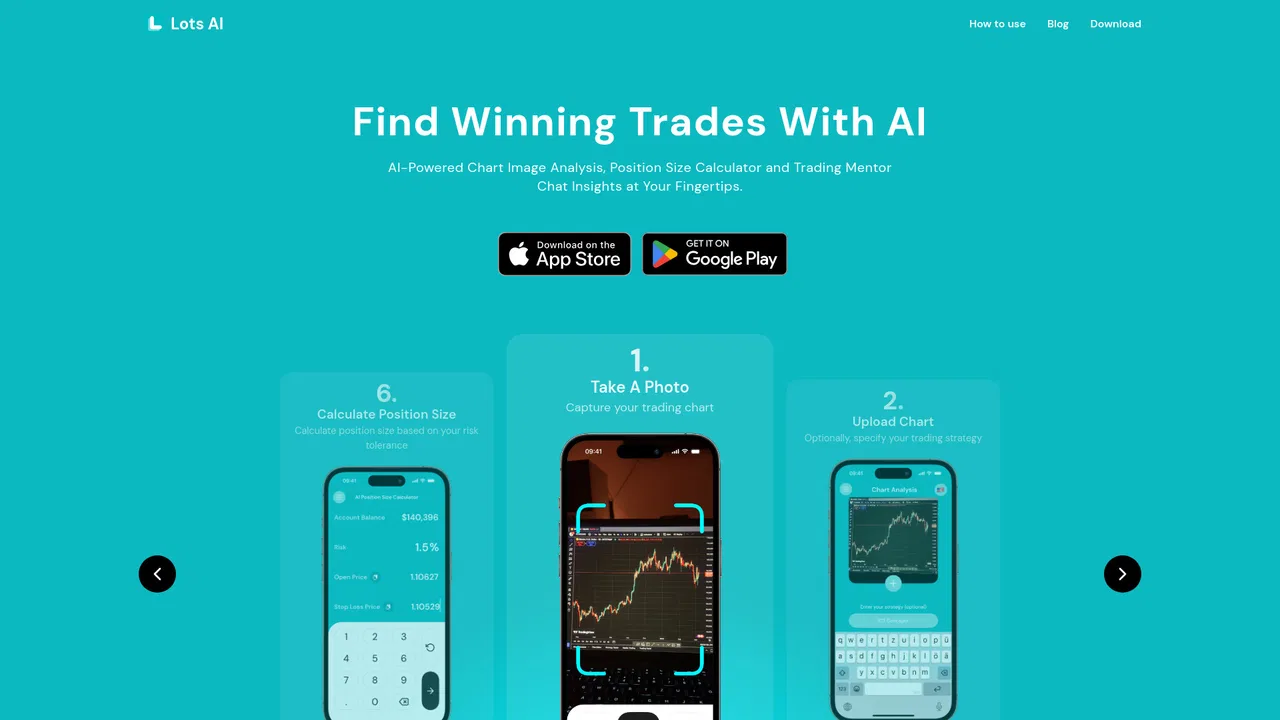
Copilote de trading IA qui lit n'importe quel graphique en 7 secondes

Graphiques et schémas en quelques secondes par conversation
ShenShu AI generates your BaZi (Four Pillars of Destiny) chart for free and then explains it with an AI reading covering career, wealth and relationships. It also offers follow-up AI questions, compatibility charts and a 10-year luck cycle calculator.

Sept modèles de prédiction IA pour cartographier et analyser les numéros de loterie
Générez et modifiez des diagrammes Mermaid, PlantUML et Excalidraw avec un chat IA

L'analyse par IA des tableurs désordonnés que vous avez déjà

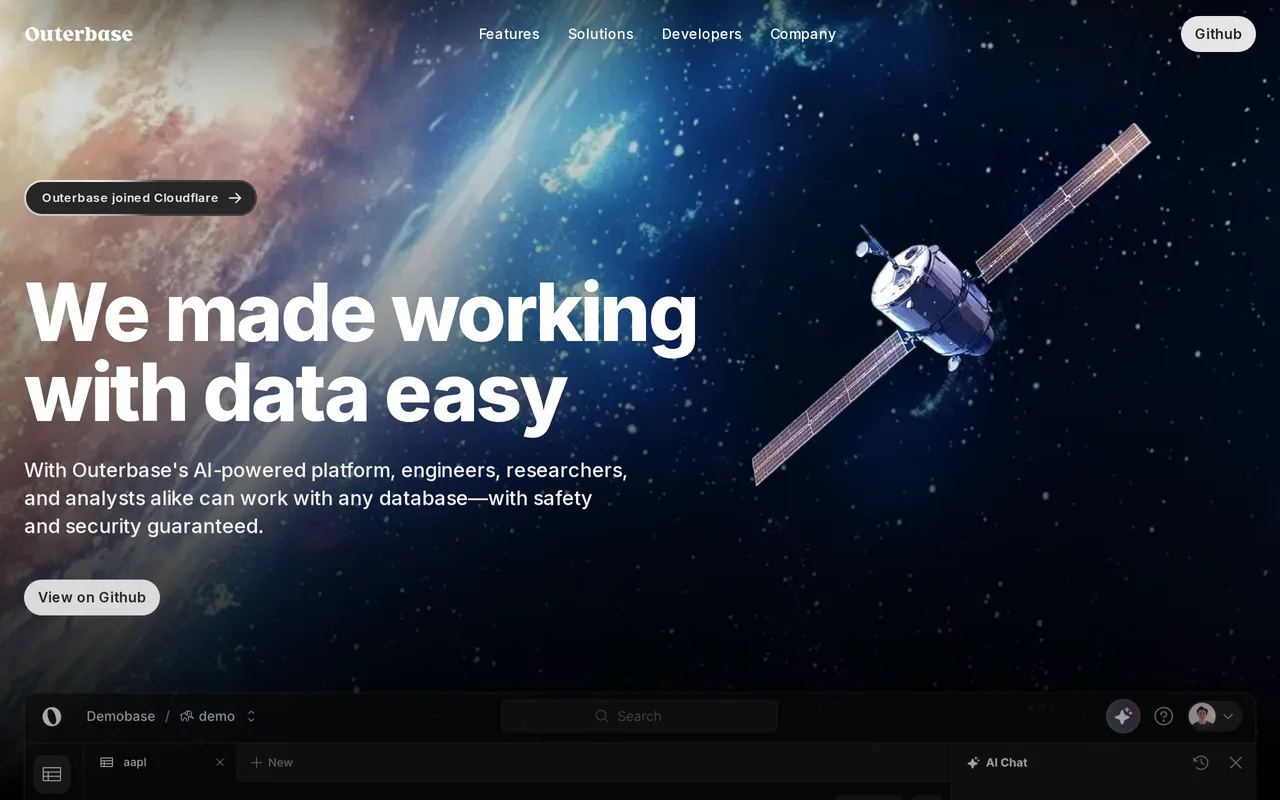
Outerbase is an AI-native workspace for exploring, querying and visualizing data across SQL and NoSQL databases. It pairs an ask-in-plain-English assistant with a spreadsheet-style table editor, dashboards and a shared data catalog, so engineers and analysts can work on the same data without fighting tooling. As of 2025 the team has joined Cloudflare.

Rose AI is a cloud data platform built for finance teams that unifies data discovery, visualization, and analysis in one workspace. It ships with an agentic engine, 50+ million time series from 30+ vendors, and natural-language query tools so analysts can move from a question to a traceable, explainable insight without stitching together separate tools.

Transformez un paragraphe en diagramme de Gantt éditable en 30 secondes environ

VMind is the intelligent visualization module in the VisActor suite. Given a dataset and a natural-language request, its LLM-driven engine recommends a chart type, maps the data to the right fields, and generates runnable VChart specs — turning conversational intent into production-ready visualizations.

Analytique conversationnelle par IA pour des insights en langage naturel

Analyse de données et graphiques par IA pour tous

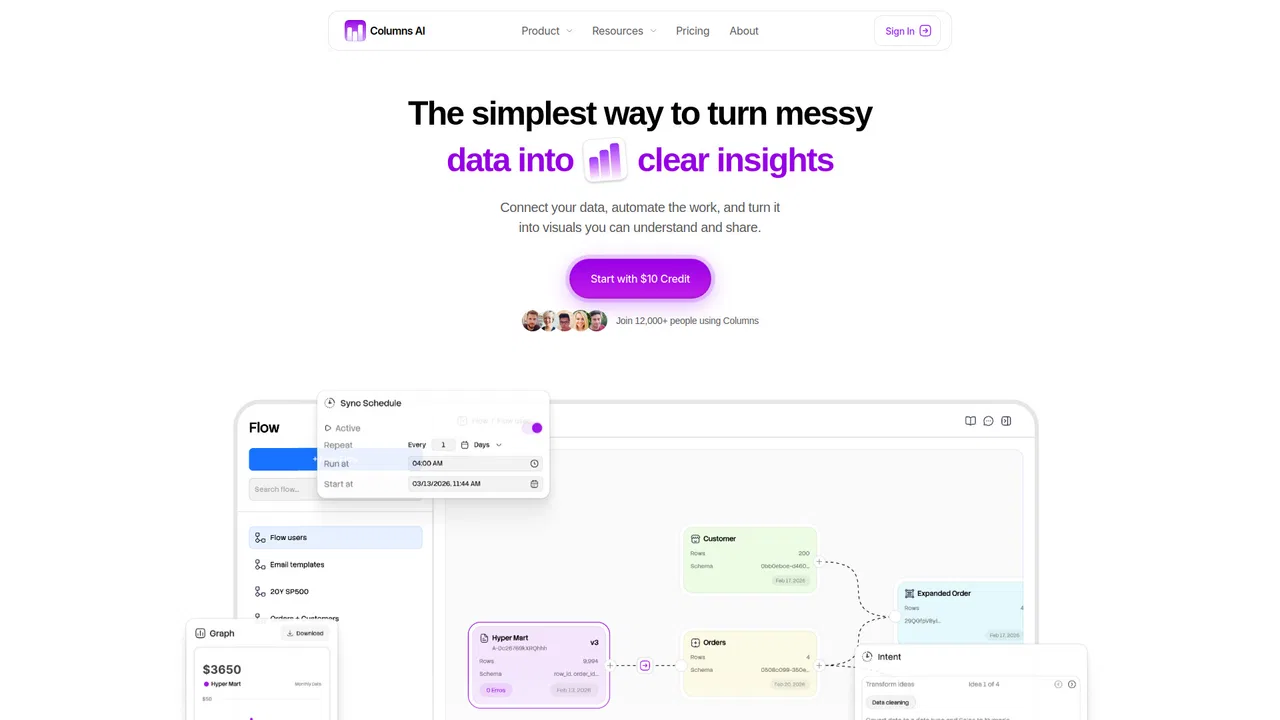
Nettoyez, automatisez et visualisez vos données dans une seule plateforme

Assistant de trading IA pour graphiques, actualités et risque

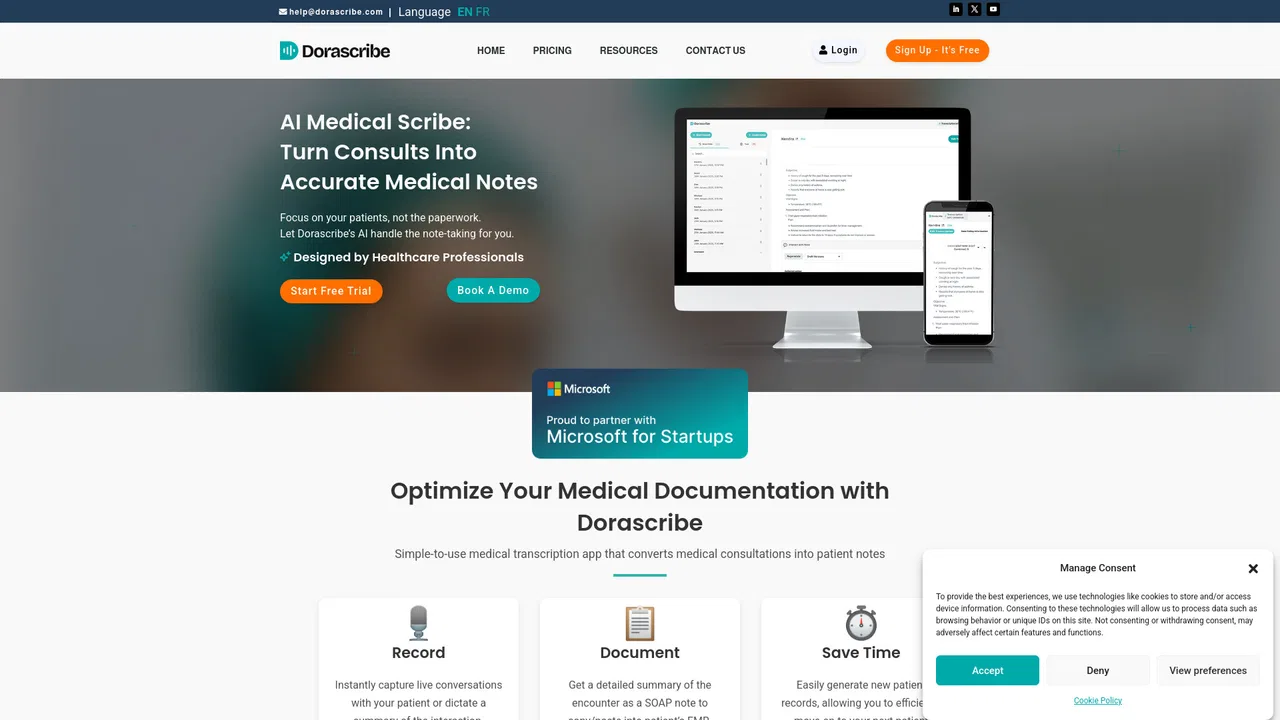
Un scribe médical IA qui transforme les consultations en notes cliniques prêtes pour le DME
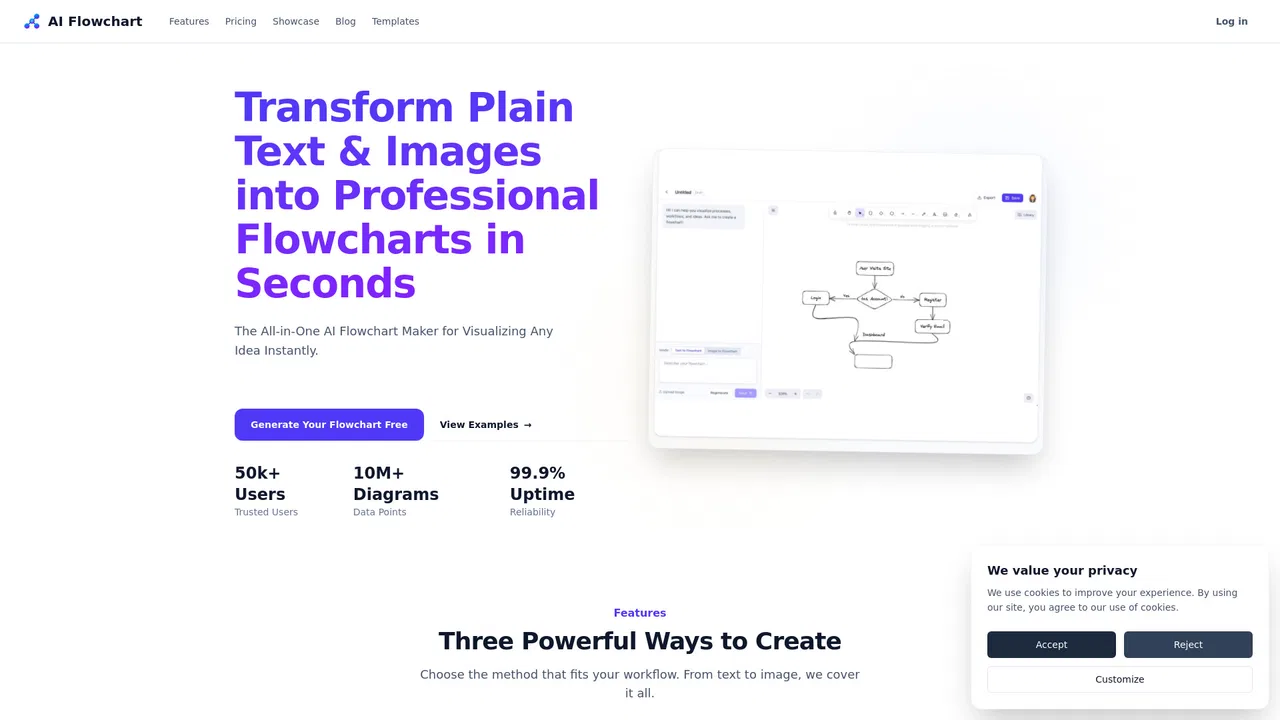
Transformez texte et images en organigrammes modifiables en quelques secondes
| Rang | Outil d'IA | Visites mensuelles | Croissance mensuelle | Visites directes | Tarifs | Marché principal | Note | Face à face |
|---|---|---|---|---|---|---|---|---|
| 1 | 20,39 M | +15,3 % | 8% | Essai gratuit, Payant | 🇺🇸 États-Unis | 3,8 | Alternatives → | |
| 2 | 665,49 k | +5 % | 40% | Essai gratuit, Tarifs sur demande | 🇮🇳 Inde | 4,4 | vs Hint | |
| 3 | 151,72 k | -11,3 % | 13% | Freemium | 🇺🇸 États-Unis | 4,4 | vs Hint | |
| 4 | | 81,22 k | -26,7 % | 25% | Freemium | 🇺🇸 États-Unis | 4,3 | vs Hint |
| 5 | | 75,54 k | +12,7 % | 43% | Essai gratuit, Payant, Tarifs sur demande | 🇺🇸 États-Unis | 4,3 | vs Hint |
| 6 | | 46,02 k | +519 % | 41% | Freemium, Essai gratuit | 🇺🇸 États-Unis | 4,6 | vs Hint |
| 7 | 45,26 k | -27,2 % | 40% | Freemium | 🇺🇸 États-Unis | 3,8 | vs Hint | |
| 8 | 38,33 k | +26,7 % | 40% | Freemium | 🇷🇺 Russie | 4,1 | vs Hint | |
| 9 | 21,91 k | -41,7 % | 40% | Payant | 🇺🇸 États-Unis | 3,8 | vs Hint | |
| 10 | | 20,38 k | -47,2 % | 40% | Freemium | 🇺🇸 États-Unis | 3,8 | vs Hint |
Votre guide personnel vers l'astrologie moderne
Des diagrammes à partir de texte, de code ou d'une simple consigne
Dialoguez avec vos données pour obtenir analyse, graphiques, rapports et diaporamas
Votre guide personnel vers l'astrologie moderne
Des diagrammes à partir de texte, de code ou d'une simple consigne
Votre guide personnel vers l'astrologie moderne
Dialoguez avec vos données pour obtenir analyse, graphiques, rapports et diaporamas
Ultimaps is a browser-based map maker that turns spreadsheet data into styled visualizations. Pick from hundreds of pre-built maps of the world, countries, US states, counties or ZIP codes, then color regions manually or import from Excel, CSV, Google Sheets or Notion. It builds color scales and legends automatically, supports pins from addresses, and exports PNG, SVG or PDF or publishes an embeddable interactive map.
Transformez des données brutes en graphiques élégants prêts à raconter
Une business intelligence native IA à laquelle toute l'équipe peut se fier
Des diagrammes à partir de texte, de code ou d'une simple consigne
vizGPT is a browser-based AI animation and graphics generator. Describe an animation in plain language and it produces a Lottie JSON file, animated SVG motion graphic or infographic that you can refine through chat and export for web, iOS and Android — alongside AI image and video generation and a data-analysis chat agent.
Transformez un texte ou des données en graphiques et schémas interactifs grâce à l'IA
Copilote de trading IA qui lit n'importe quel graphique en 7 secondes
Graphiques et schémas en quelques secondes par conversation
ShenShu AI generates your BaZi (Four Pillars of Destiny) chart for free and then explains it with an AI reading covering career, wealth and relationships. It also offers follow-up AI questions, compatibility charts and a 10-year luck cycle calculator.
Sept modèles de prédiction IA pour cartographier et analyser les numéros de loterie
Générez et modifiez des diagrammes Mermaid, PlantUML et Excalidraw avec un chat IA
Outerbase is an AI-native workspace for exploring, querying and visualizing data across SQL and NoSQL databases. It pairs an ask-in-plain-English assistant with a spreadsheet-style table editor, dashboards and a shared data catalog, so engineers and analysts can work on the same data without fighting tooling. As of 2025 the team has joined Cloudflare.
Rose AI is a cloud data platform built for finance teams that unifies data discovery, visualization, and analysis in one workspace. It ships with an agentic engine, 50+ million time series from 30+ vendors, and natural-language query tools so analysts can move from a question to a traceable, explainable insight without stitching together separate tools.
Transformez un paragraphe en diagramme de Gantt éditable en 30 secondes environ
VMind is the intelligent visualization module in the VisActor suite. Given a dataset and a natural-language request, its LLM-driven engine recommends a chart type, maps the data to the right fields, and generates runnable VChart specs — turning conversational intent into production-ready visualizations.
Analytique conversationnelle par IA pour des insights en langage naturel
Analyse de données et graphiques par IA pour tous
Nettoyez, automatisez et visualisez vos données dans une seule plateforme
Assistant de trading IA pour graphiques, actualités et risque
Un scribe médical IA qui transforme les consultations en notes cliniques prêtes pour le DME
Transformez texte et images en organigrammes modifiables en quelques secondes