
Transformez un texte ou des données en graphiques et schémas interactifs grâce à l'IA
Comparez les produits d’IA pour 459 workflows à partir du trafic estimé, des fonctionnalités et des alternatives.
“Graph visualization”·566 résultats
RecommencerTransformez un texte ou des données en graphiques et schémas interactifs grâce à l'IA
Transformez un texte ou des données en graphiques et schémas interactifs grâce à l'IA

Transformez des données brutes en graphiques élégants prêts à raconter

Graphiques et schémas en quelques secondes par conversation
Solveur mathématique IA qui explique chaque étape et anime la solution

Analyse de texte par IA avec graphes de connaissances pour révéler sujets et lacunes
Explorer la littérature scientifique comme un graphe visuel d'articles liés

Explorer visuellement le savoir scientifique grâce à l'IA

Base de données graphe sur stockage objet pour la mémoire des agents
WolframAlpha is a computational knowledge engine that answers factual, mathematical, and scientific queries by computing results from curated data and algorithms rather than just searching for them.

Studio visuel d'IA à nœuds pour image, vidéo, 3D et audio

Transforme vos tableaux de bord BI en plans d'action par site

Napkin AI is a visual communication platform that turns plain text into diagrams, infographics, flowcharts, mind maps, data charts, and full presentation decks — no prompt engineering required.
Transformez textes, code ou PDF en organigrammes modifiables

TradesViz is a feature-dense online trading journal that works across stocks, options, futures, forex, crypto and event contracts. It auto-syncs trades from hundreds of brokers, computes 600+ statistics and interactive charts, and layers an AI suite on top — including an AI Coach that reviews your trades, an AI Query tool that answers questions about your data in plain English, and a hosted MCP connection so ChatGPT or Claude can read your journal.

Wikis générés par IA et chat pour tout dépôt GitHub public

ResearchRabbit is a free AI research discovery tool that maps the literature around the papers you care about. Seed it with a paper you like and it visualises related work, key authors and emerging topics, learning from your choices to surface the research you have been missing.
Transformez PDF, notes de cours et longs chats en cartes conceptuelles présentables

Transformez textes et données en infographies, rapports et vidéos soignés grâce à l'IA

Figures scientifiques et résumés graphiques éditables à partir d'un prompt

Cours interactifs en science des données, IA et analyse

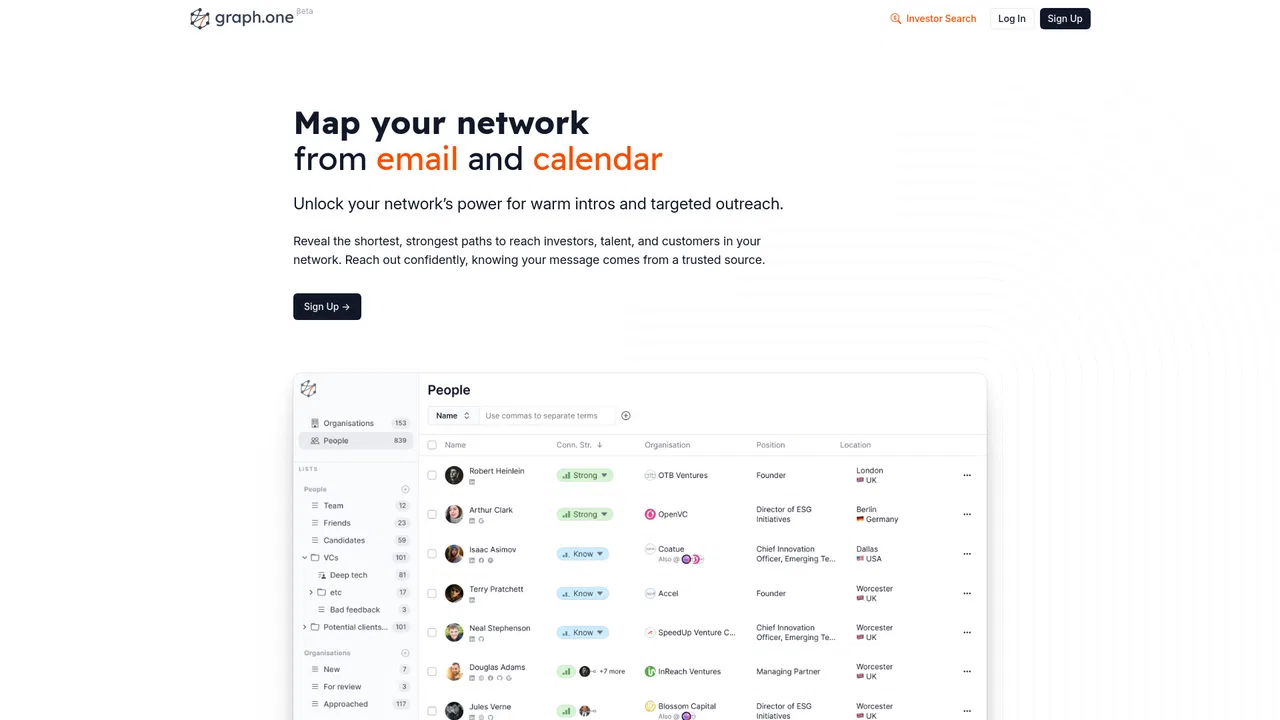
Transformez les contacts éparpillés de votre cabinet en un graphe de relations unique
Ultimaps is a browser-based map maker that turns spreadsheet data into styled visualizations. Pick from hundreds of pre-built maps of the world, countries, US states, counties or ZIP codes, then color regions manually or import from Excel, CSV, Google Sheets or Notion. It builds color scales and legends automatically, supports pins from addresses, and exports PNG, SVG or PDF or publishes an embeddable interactive map.
Des diagrammes IA et des documents de conception technique issus de votre code et de vos systèmes

Studio de rendu IA qui transforme croquis, photos et vues SketchUp, Revit ou Rhino en images d'architecture prêtes à présenter