3.8万/月+26.7%
テキストやデータをAIでインタラクティブなグラフ・図解に変換
フリーミアム

機能と用途で選んだ、ChartAI の代替ツール 12 件。
| 順位 | ツールとキャッチコピー | 公式ドメイン | 月間訪問数 | 前月比成長率 | 料金モデル | 主要市場 | 評価 | 比較 |
|---|---|---|---|---|---|---|---|---|
| ● |
| ChartAI |
| chartai.io |
| 2.04万 |
| -1.82万 (-47.2%) |
| フリーミアム |
| アメリカ合衆国 |
| 3.8 |
| プロフィール |
| 1 | AI Graph Maker | aigraphmaker.net | 3.83万 | 8089 (+26.7%) | フリーミアム | ロシア | 4.1 | 比較 |
| 2 | Graphy | graphy.app | 8.12万 | -2.96万 (-26.7%) | フリーミアム | アメリカ合衆国 | 4.3 | 比較 |
| 3 | Diagramming AI | diagrammingai.com | 1.46万 | -6390 (-30.5%) | フリーミアム、無料トライアル | インド | 4.4 | 比較 |
| 4 | Julius AI | julius.ai | 66.55万 | 3.18万 (+5%) | 無料トライアル、料金は要問い合わせ | インド | 4.4 | 比較 |
| 5 | Mermaid Chart | mermaidchart.com | 4.6万 | 3.86万 (+519%) | フリーミアム、無料トライアル | アメリカ合衆国 | 4.6 | 比較 |
| 6 | Edraw.AI | edraw.ai | 21.65万 | -2.51万 (-10.4%) | フリーミアム、無料トライアル、有料 | アメリカ合衆国 | 4.2 | 比較 |
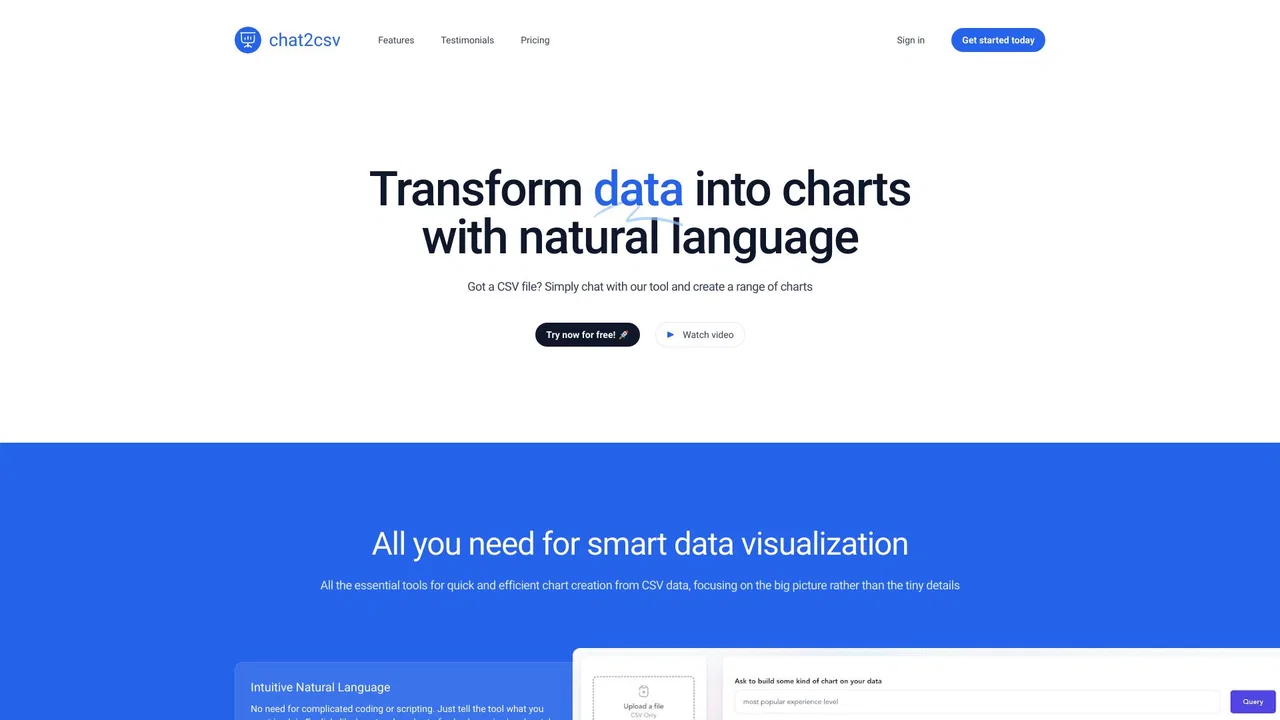
| 7 | Chat2CSV | chat2csv.com | 71 | -337 (-82.6%) | フリーミアム | アメリカ合衆国 | 4.1 | 比較 |
| 8 | ChartPixel | chartpixel.com | 3036 | -654 (-17.7%) | フリーミアム、有料、料金は要問い合わせ | アメリカ合衆国 | 4.1 | 比較 |
| 9 | Ultimaps | ultimaps.com | 15.17万 | -1.93万 (-11.3%) | フリーミアム | アメリカ合衆国 | 4.4 | 比較 |
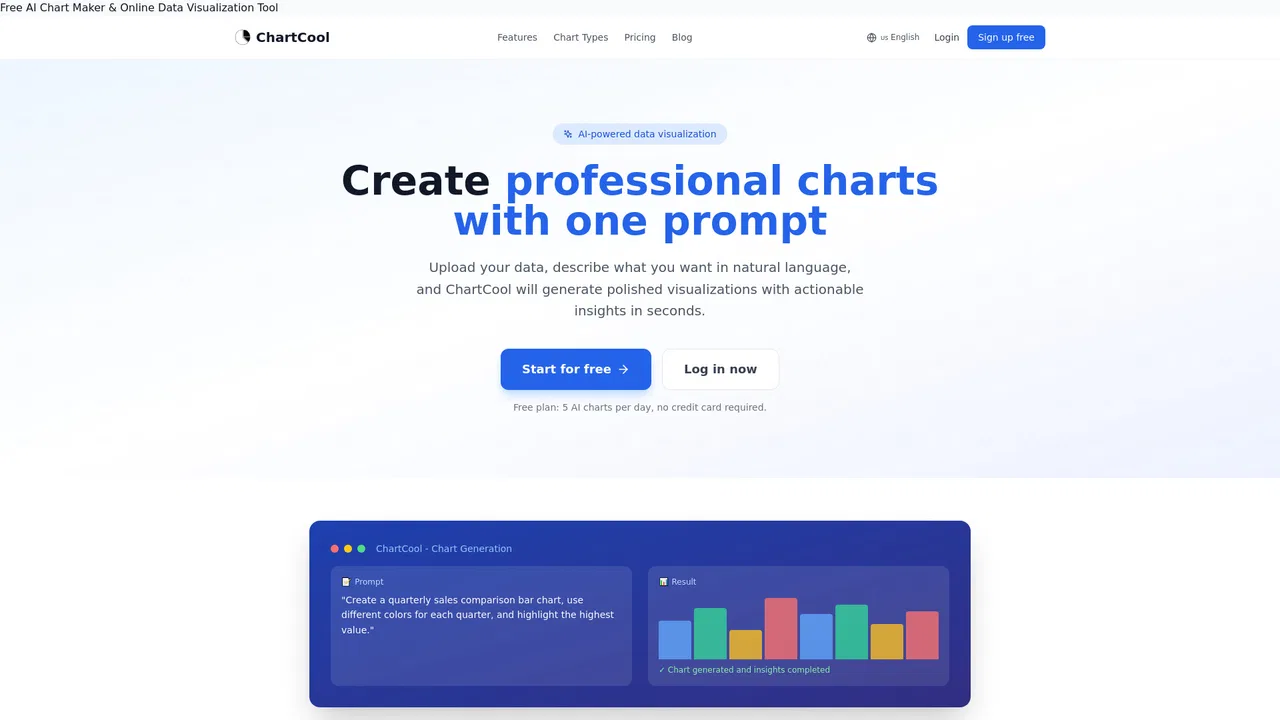
| 10 | ChartCool | ai.ichartcool.com | 0 | 0 (0%) | フリーミアム、無料 | グローバル | 4 | 比較 |
| 11 | RapidChart.ai | rapidcharts.ai | 6805 | -9593 (-58.5%) | 無料 | アメリカ合衆国 | 4.2 | 比較 |
| 12 | SciDraw AI | sci-draw.com | 14.65万 | 1.35万 (+10.1%) | フリーミアム | アメリカ合衆国 | 4.2 | 比較 |
テキストやデータをAIでインタラクティブなグラフ・図解に変換
AIチャットでMermaid・PlantUML・Excalidrawの図を生成・編集
AIチャットでMermaid・PlantUML・Excalidrawの図を生成・編集
データと対話して分析・グラフ・レポート・スライドを得る
テキスト・コード・ひと言から図を生成
図解・マインドマップ・チャートを支えるAIビジュアルコラボレーション
誰でも使えるAIデータ分析とチャート生成
Ultimaps is a browser-based map maker that turns spreadsheet data into styled visualizations. Pick from hundreds of pre-built maps of the world, countries, US states, counties or ZIP codes, then color regions manually or import from Excel, CSV, Google Sheets or Notion. It builds color scales and legends automatically, supports pins from addresses, and exports PNG, SVG or PDF or publishes an embeddable interactive map.
Ultimaps is a browser-based map maker that turns spreadsheet data into styled visualizations. Pick from hundreds of pre-built maps of the world, countries, US states, counties or ZIP codes, then color regions manually or import from Excel, CSV, Google Sheets or Notion. It builds color scales and legends automatically, supports pins from addresses, and exports PNG, SVG or PDF or publishes an embeddable interactive map.
技術図を数時間ではなく数分で作成。

特化型SciDraw AI turns a text description, a rough sketch or a CSV file into publication-ready scientific illustrations and journal-styled charts, exporting fully editable SVG and PPTX vector files instead of flat images.
特化型SciDraw AI turns a text description, a rough sketch or a CSV file into publication-ready scientific illustrations and journal-styled charts, exporting fully editable SVG and PPTX vector files instead of flat images.