このビューには、該当する AI チャート作成 AI ツール 134 件のうち 24 件を表示しています。表示中のツールの月間訪問数は合計 2164.5万です。Hint は月間 2039.45万訪問を記録しています。
| 順位 | AI ツール | 月間訪問数 | 前月比成長率 | 直接アクセス | 料金 | 最大市場 | 評価 | 直接比較 |
|---|---|---|---|---|---|---|---|---|
| 1 | 2039.45万 | +15.3% | 8% | 無料トライアル、有料 | 🇺🇸 アメリカ合衆国 | 3.8 | 代替ツール → | |
| 2 | 66.55万 | +5% | 40% | 無料トライアル、料金は要問い合わせ | 🇮🇳 インド | 4.4 | vs Hint | |
| 3 | 15.17万 | -11.3% | 13% | フリーミアム | 🇺🇸 アメリカ合衆国 | 4.4 | vs Hint | |
| 4 | ![]() | 8.12万 | -26.7% | 25% | フリーミアム | 🇺🇸 アメリカ合衆国 | 4.3 | vs Hint |
| 5 | ![]() | 7.55万 | +12.7% | 43% | 無料トライアル、有料、料金は要問い合わせ | 🇺🇸 アメリカ合衆国 | 4.3 | vs Hint |
| 6 | ![]() | 4.6万 | +519% | 41% | フリーミアム、無料トライアル | 🇺🇸 アメリカ合衆国 | 4.6 | vs Hint |
| 7 | 4.53万 | -27.2% | 40% | フリーミアム | 🇺🇸 アメリカ合衆国 | 3.8 | vs Hint | |
| 8 | 3.83万 | +26.7% | 40% | フリーミアム | 🇷🇺 ロシア | 4.1 | vs Hint | |
| 9 | 2.19万 | -41.7% | 40% | 有料 | 🇺🇸 アメリカ合衆国 | 3.8 | vs Hint | |
| 10 | ![]() | 2.04万 | -47.2% | 40% | フリーミアム | 🇺🇸 アメリカ合衆国 | 3.8 | vs Hint |

Ultimaps is a browser-based map maker that turns spreadsheet data into styled visualizations. Pick from hundreds of pre-built maps of the world, countries, US states, counties or ZIP codes, then color regions manually or import from Excel, CSV, Google Sheets or Notion. It builds color scales and legends automatically, supports pins from addresses, and exports PNG, SVG or PDF or publishes an embeddable interactive map.
vizGPT is a browser-based AI animation and graphics generator. Describe an animation in plain language and it produces a Lottie JSON file, animated SVG motion graphic or infographic that you can refine through chat and export for web, iOS and Android — alongside AI image and video generation and a data-analysis chat agent.
ShenShu AI generates your BaZi (Four Pillars of Destiny) chart for free and then explains it with an AI reading covering career, wealth and relationships. It also offers follow-up AI questions, compatibility charts and a 10-year luck cycle calculator.
AIチャットでMermaid・PlantUML・Excalidrawの図を生成・編集

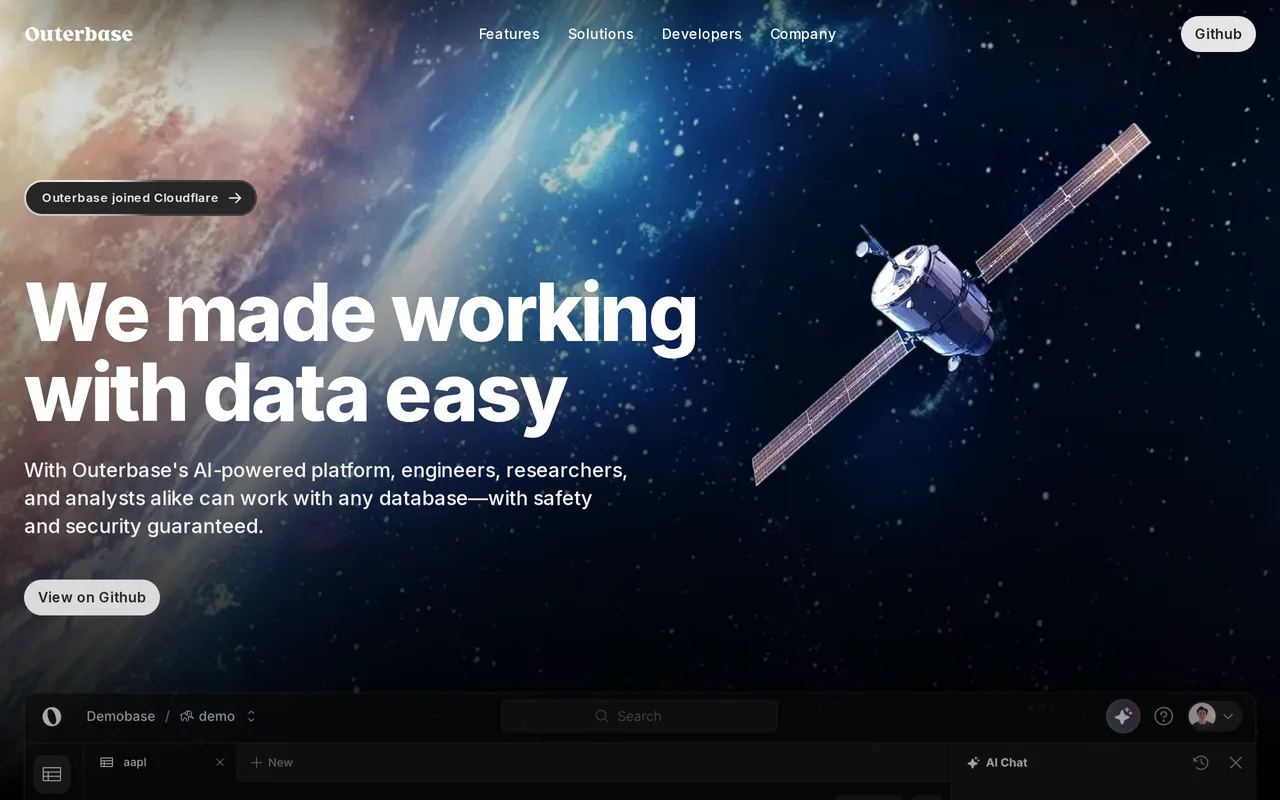
Outerbase is an AI-native workspace for exploring, querying and visualizing data across SQL and NoSQL databases. It pairs an ask-in-plain-English assistant with a spreadsheet-style table editor, dashboards and a shared data catalog, so engineers and analysts can work on the same data without fighting tooling. As of 2025 the team has joined Cloudflare.

Rose AI is a cloud data platform built for finance teams that unifies data discovery, visualization, and analysis in one workspace. It ships with an agentic engine, 50+ million time series from 30+ vendors, and natural-language query tools so analysts can move from a question to a traceable, explainable insight without stitching together separate tools.

VMind is the intelligent visualization module in the VisActor suite. Given a dataset and a natural-language request, its LLM-driven engine recommends a chart type, maps the data to the right fields, and generates runnable VChart specs — turning conversational intent into production-ready visualizations.
テキスト・コード・ひと言から図を生成
データと対話して分析・グラフ・レポート・スライドを得る
Ultimaps is a browser-based map maker that turns spreadsheet data into styled visualizations. Pick from hundreds of pre-built maps of the world, countries, US states, counties or ZIP codes, then color regions manually or import from Excel, CSV, Google Sheets or Notion. It builds color scales and legends automatically, supports pins from addresses, and exports PNG, SVG or PDF or publishes an embeddable interactive map.
チーム全員が信頼できるAIネイティブなBIプラットフォーム
テキスト・コード・ひと言から図を生成
vizGPT is a browser-based AI animation and graphics generator. Describe an animation in plain language and it produces a Lottie JSON file, animated SVG motion graphic or infographic that you can refine through chat and export for web, iOS and Android — alongside AI image and video generation and a data-analysis chat agent.
テキストやデータをAIでインタラクティブなグラフ・図解に変換
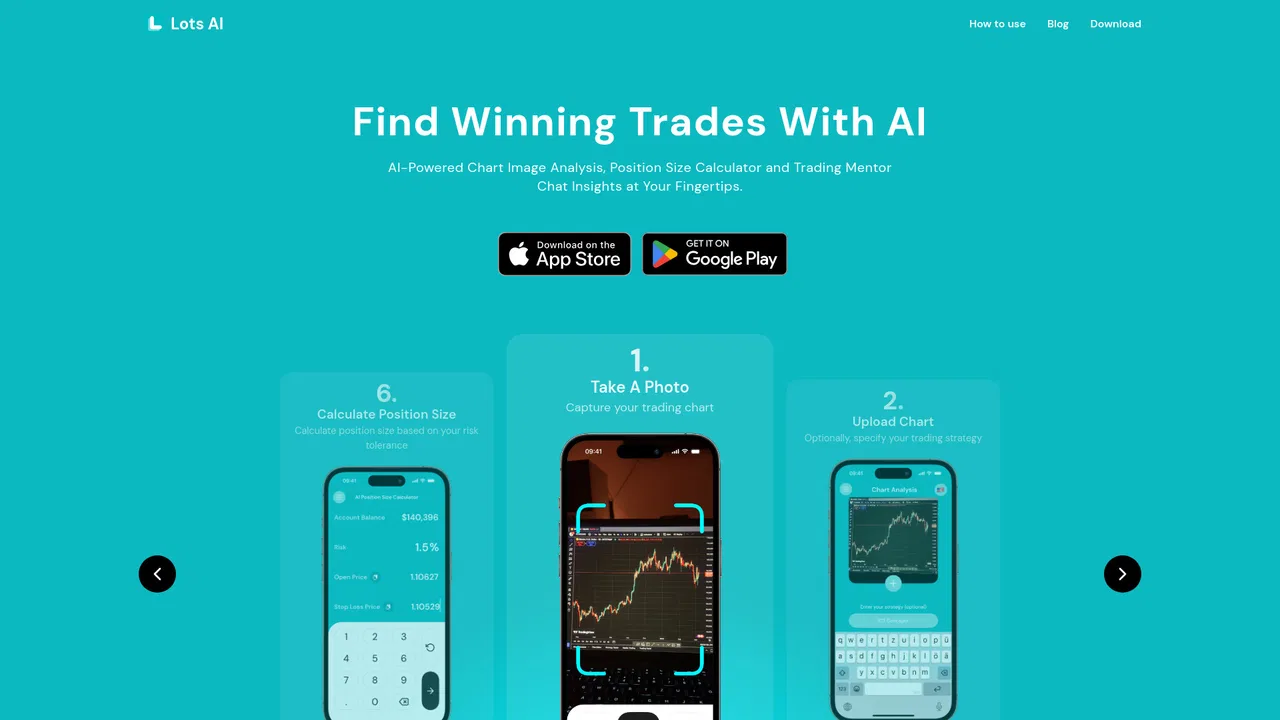
あらゆるチャートを7秒で読むAIトレード副操縦士
ShenShu AI generates your BaZi (Four Pillars of Destiny) chart for free and then explains it with an AI reading covering career, wealth and relationships. It also offers follow-up AI questions, compatibility charts and a 10-year luck cycle calculator.
7つのAI予測モデルで宝くじの数字を分析・チャート化
AIチャットでMermaid・PlantUML・Excalidrawの図を生成・編集
手元にある“きたない表”のためのAIデータ分析アシスタント
Outerbase is an AI-native workspace for exploring, querying and visualizing data across SQL and NoSQL databases. It pairs an ask-in-plain-English assistant with a spreadsheet-style table editor, dashboards and a shared data catalog, so engineers and analysts can work on the same data without fighting tooling. As of 2025 the team has joined Cloudflare.
Rose AI is a cloud data platform built for finance teams that unifies data discovery, visualization, and analysis in one workspace. It ships with an agentic engine, 50+ million time series from 30+ vendors, and natural-language query tools so analysts can move from a question to a traceable, explainable insight without stitching together separate tools.
ひとつの段落から約30秒で編集可能なガントチャートを作成

VMind is the intelligent visualization module in the VisActor suite. Given a dataset and a natural-language request, its LLM-driven engine recommends a chart type, maps the data to the right fields, and generates runnable VChart specs — turning conversational intent into production-ready visualizations.
自然言語でデータを分析する会話型AIアナリティクス
誰でも使えるAIデータ分析とチャート生成
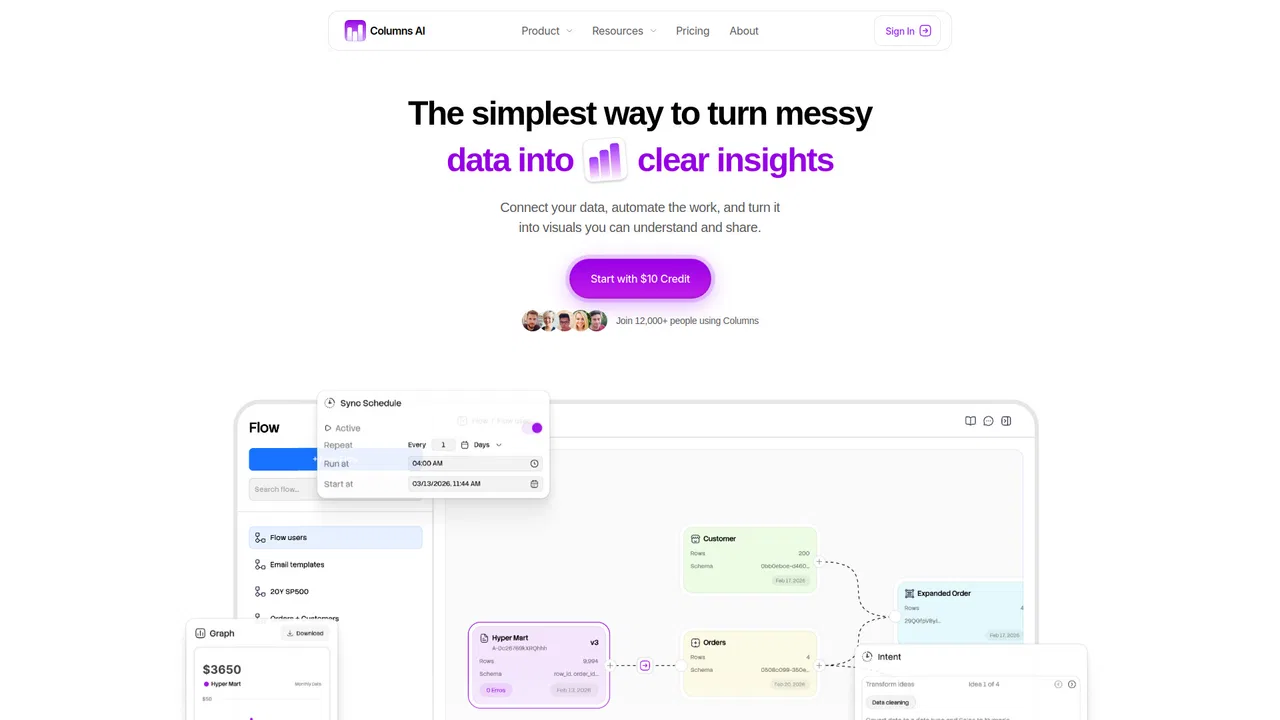
データのクリーンアップ、自動化、可視化を1つのプラットフォームで
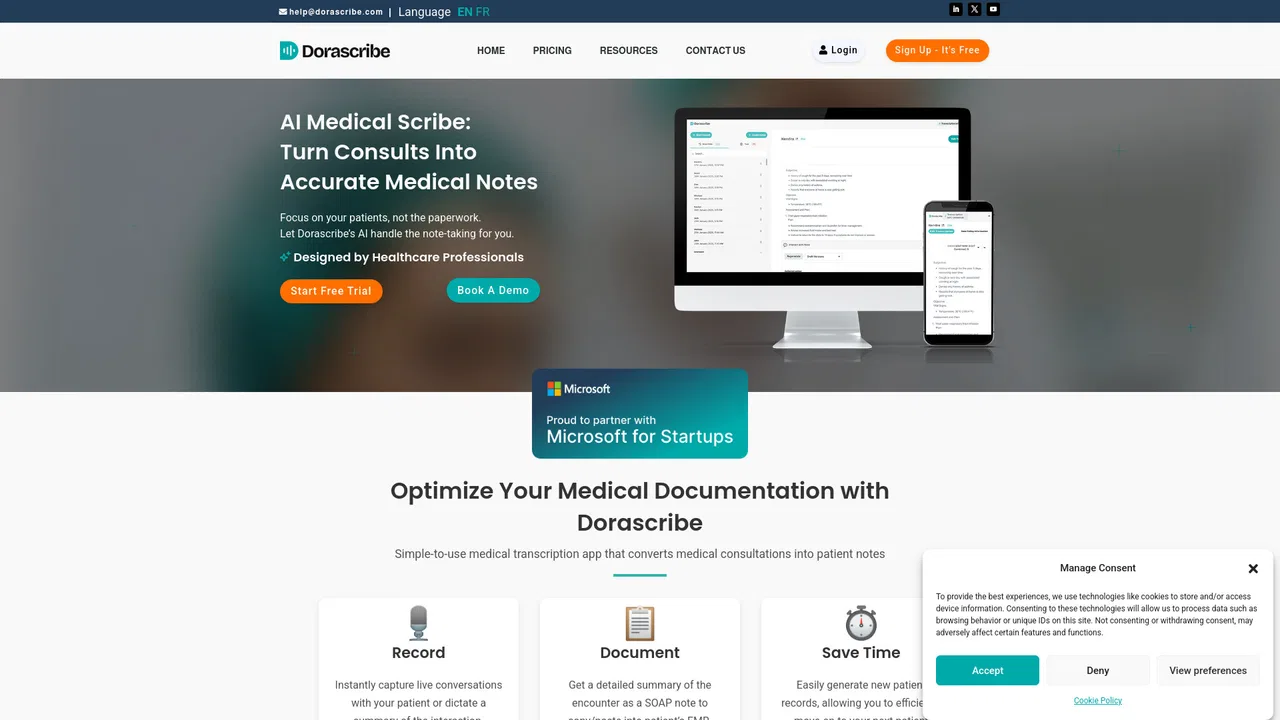
診察会話をEMRに取り込める診療記録へ変えるAIメディカルスクライブ
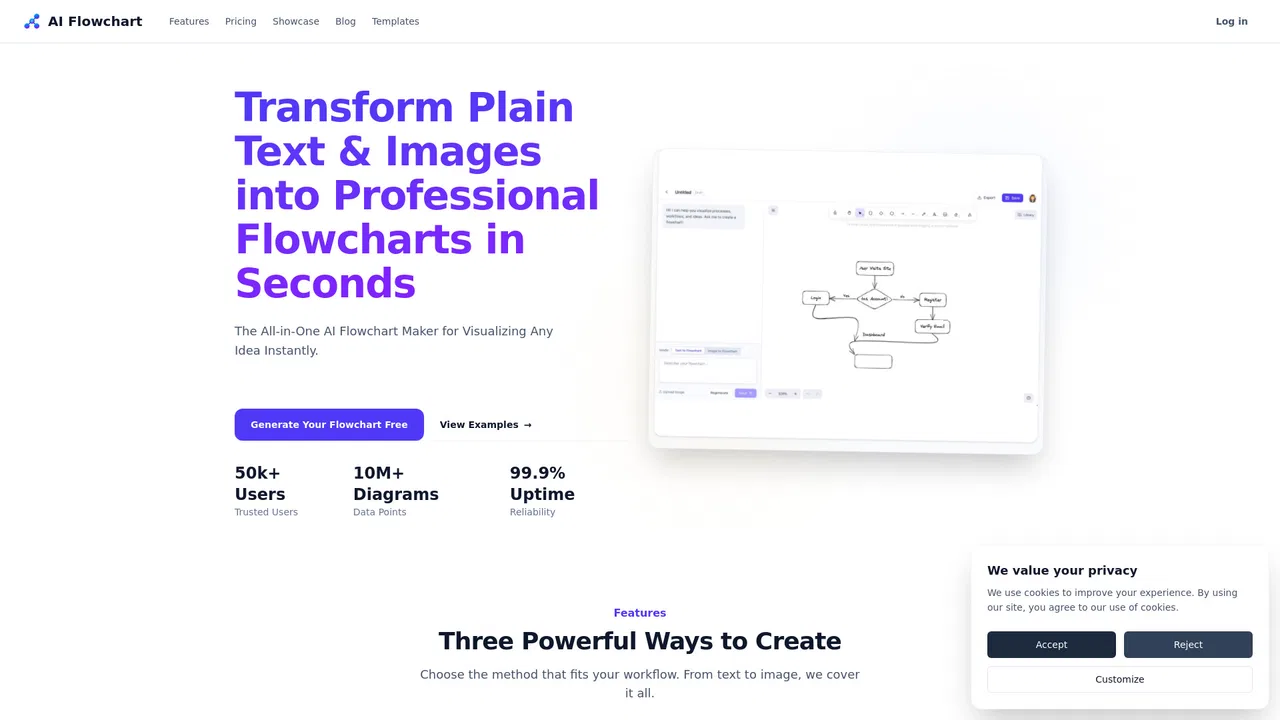
テキストと画像から編集可能なフローチャートを数秒で作成