01
66.5万/月
高度な統計分析とPython実行機能を提供しますが、シンプルな即席チャート生成ツールよりは少し重厚です。
データ分析のためのAI編集部スコア:4.4無料トライアル、料金は要問い合わせ+5%

66.5万/月+5%
高度な統計分析とPython実行機能を提供しますが、シンプルな即席チャート生成ツールよりは少し重厚です。
無料トライアル、料金は要問い合わせ
翻訳の完了までの間、一部のコンテンツは英語で表示されます。
機能と用途で選んだ、ChartGen.ai の代替ツール 12 件。
| 順位 | ツールとキャッチコピー | 公式ドメイン | 月間訪問数 | 前月比成長率 | 料金モデル | 主要市場 | 評価 | 比較 |
|---|---|---|---|---|---|---|---|---|
| ● | ChartGen.ai | chartgen.ai | 13.92万 | -8699 (-5.9%) |
| 柔軟 |
| インド |
| — |
| プロフィール |
| 1 | Julius AI | julius.ai | 66.55万 | 3.18万 (+5%) | 無料トライアル、料金は要問い合わせ | インド | 4.4 | 比較 |
| 2 | Graphy | graphy.app | 8.12万 | -2.96万 (-26.7%) | フリーミアム | アメリカ合衆国 | 4.3 | 比較 |
| 3 | Napkin AI | napkin.ai | 103万 | -21.81万 (-17.5%) | フリーミアム | インド | 4.7 | 比較 |
| 4 | Sourcetable — AI スプレッドシート&データアナリスト | sourcetable.com | 3.85万 | 4479 (+13.2%) | フリーミアム、無料トライアル、有料 | アメリカ合衆国 | 4.4 | 比較 |
| 5 | Basedash | basedash.com | 7.55万 | 8530 (+12.7%) | 無料トライアル、有料、料金は要問い合わせ | アメリカ合衆国 | 4.3 | 比較 |
| 6 | ChartAI | chartai.io | 2.04万 | -1.82万 (-47.2%) | フリーミアム | アメリカ合衆国 | 3.8 | 比較 |
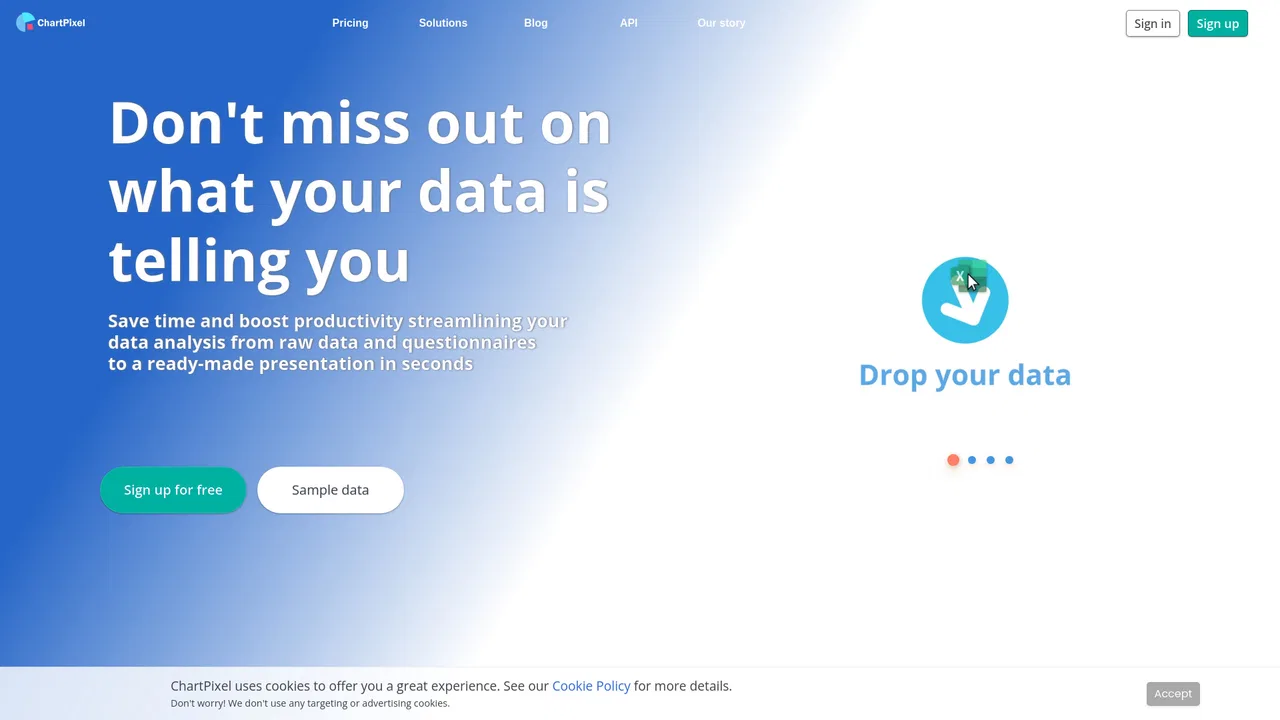
| 7 | ChartPixel | chartpixel.com | 3036 | -654 (-17.7%) | フリーミアム、有料、料金は要問い合わせ | アメリカ合衆国 | 4.1 | 比較 |
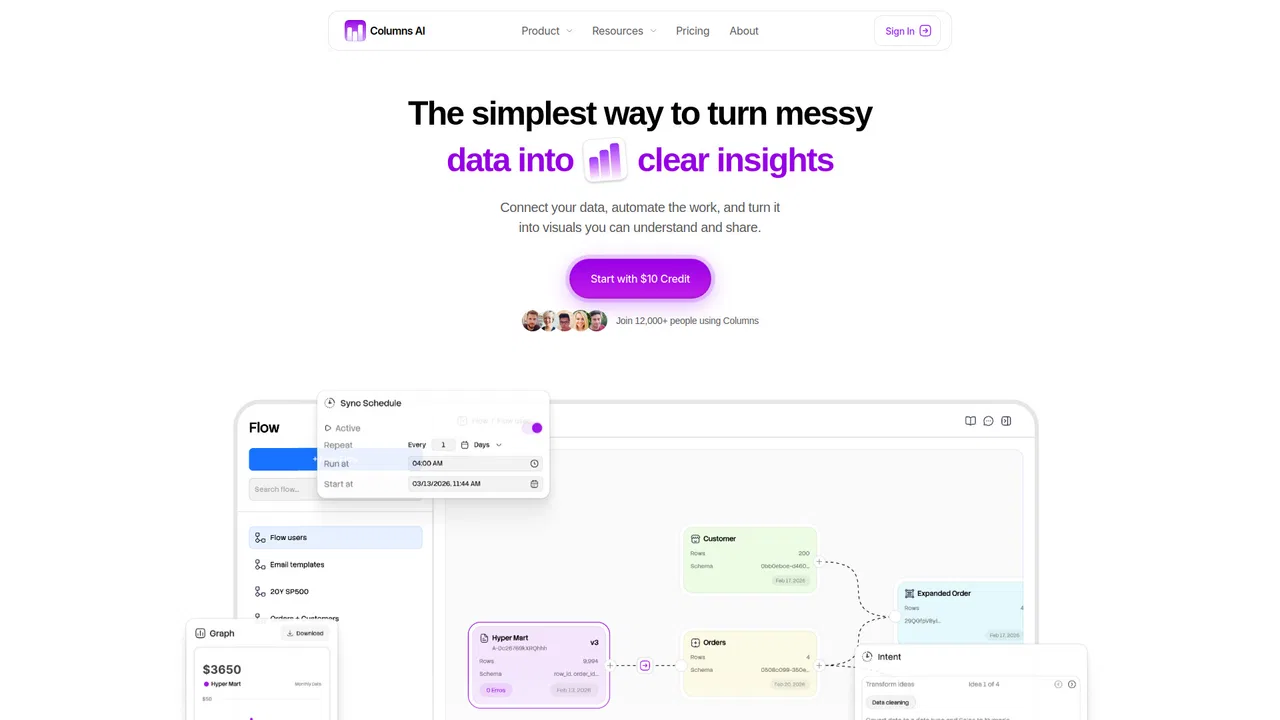
| 8 | Columns AI | columns.ai | 1387 | -788 (-36.2%) | フリーミアム、有料 | アメリカ合衆国 | 4.2 | 比較 |
| 9 | ExcelDashboard AI | exceldashboard.ai | 1.15万 | 2104 (+22.3%) | フリーミアム | インド | 4.3 | 比較 |
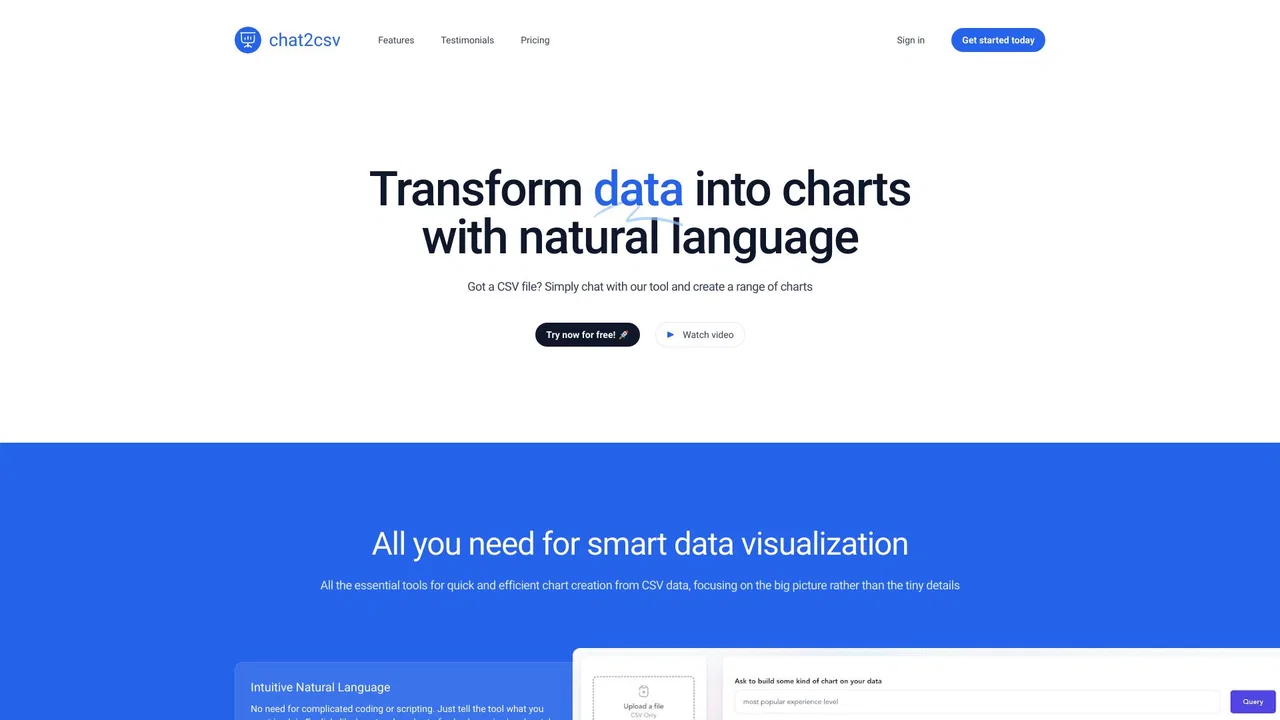
| 10 | Chat2CSV | chat2csv.com | 71 | -337 (-82.6%) | フリーミアム | アメリカ合衆国 | 4.1 | 比較 |
| 11 | ChartCool | ai.ichartcool.com | 0 | 0 (0%) | フリーミアム、無料 | グローバル | 4 | 比較 |
| 12 | Hex | hex.tech | 78.27万 | 7.66万 (+10.8%) | フリーミアム、無料トライアル、有料、料金は要問い合わせ、無料 | アメリカ合衆国 | 4.7 | 比較 |
高度な統計分析とPython実行機能を提供しますが、シンプルな即席チャート生成ツールよりは少し重厚です。
高度な統計分析とPython実行機能を提供しますが、シンプルな即席チャート生成ツールよりは少し重厚です。

特化型テキストや構造化データを即座に図やインフォグラフィックに変換しますが、スプレッドシートの数式計算への特化度は低めです。

AIスプレッドシートインターフェースと自動チャート作成を組み合わせたものですが、基本的には本格的なスプレッドシートとして機能します。
AIスプレッドシートインターフェースと自動チャート作成を組み合わせたものですが、基本的には本格的なスプレッドシートとして機能します。

特化型自然言語をデータベースのダッシュボードやSQLクエリに変換し、ライブデータベース接続に最適です。
特化型自然言語をデータベースのダッシュボードやSQLクエリに変換し、ライブデータベース接続に最適です。

Turns messy data tables into clean charts and statistical insights automatically.
Turns messy data tables into clean charts and statistical insights automatically.

Transforms raw files into interactive charts and dashboards, though with fewer advanced analytics features.
Transforms raw files into interactive charts and dashboards, though with fewer advanced analytics features.

特化型Specializes in turning Excel and CSV data into interactive KPI dashboards and PowerPoint slides.
特化型Specializes in turning Excel and CSV data into interactive KPI dashboards and PowerPoint slides.

Offers simple conversational charting from CSV uploads, but lacks advanced data modeling.
Converts plain-language prompts and data into polished visualizations instantly.

特化型Provides powerful collaborative notebooks and agentic analytics for data teams, but has a more advanced workflow.
特化型Provides powerful collaborative notebooks and agentic analytics for data teams, but has a more advanced workflow.