01
66.5만/월
심층적인 통계 분석과 Python 실행을 제공하지만, 단순한 즉석 차트 생성기보다는 무겁습니다.
데이터 분석용 AI에디터 평점: 4.4무료 체험, 가격 문의+5%

66.5만/월+5%
심층적인 통계 분석과 Python 실행을 제공하지만, 단순한 즉석 차트 생성기보다는 무겁습니다.
무료 체험, 가격 문의
번역이 완료되는 동안 일부 콘텐츠가 영어로 표시됩니다.
기능과 용도를 기준으로 고른 ChartGen.ai 대안 도구 12개입니다.
| 순위 | 도구 및 소개 문구 | 공식 도메인 | 월간 방문 수 | 전월 대비 성장률 | 가격 모델 | 주요 시장 | 평점 | 비교 |
|---|---|---|---|---|---|---|---|---|
| ● | ChartGen.ai | chartgen.ai | 13.92만 | -8.7천 (-5.9%) |
| 유연함 |
| 인도 |
| — |
| 프로필 |
| 1 | Julius AI | julius.ai | 66.55만 | 3.18만 (+5%) | 무료 체험, 가격 문의 | 인도 | 4.4 | 비교 |
| 2 | Graphy | graphy.app | 8.12만 | -2.96만 (-26.7%) | 무료+유료 | 미국 | 4.3 | 비교 |
| 3 | Napkin AI | napkin.ai | 103만 | -21.81만 (-17.5%) | 무료+유료 | 인도 | 4.7 | 비교 |
| 4 | Sourcetable — AI 스프레드시트 & 데이터 분석가 | sourcetable.com | 3.85만 | 4.48천 (+13.2%) | 무료+유료, 무료 체험, 유료 | 미국 | 4.4 | 비교 |
| 5 | Basedash | basedash.com | 7.55만 | 8.53천 (+12.7%) | 무료 체험, 유료, 가격 문의 | 미국 | 4.3 | 비교 |
| 6 | ChartAI | chartai.io | 2.04만 | -1.82만 (-47.2%) | 무료+유료 | 미국 | 3.8 | 비교 |
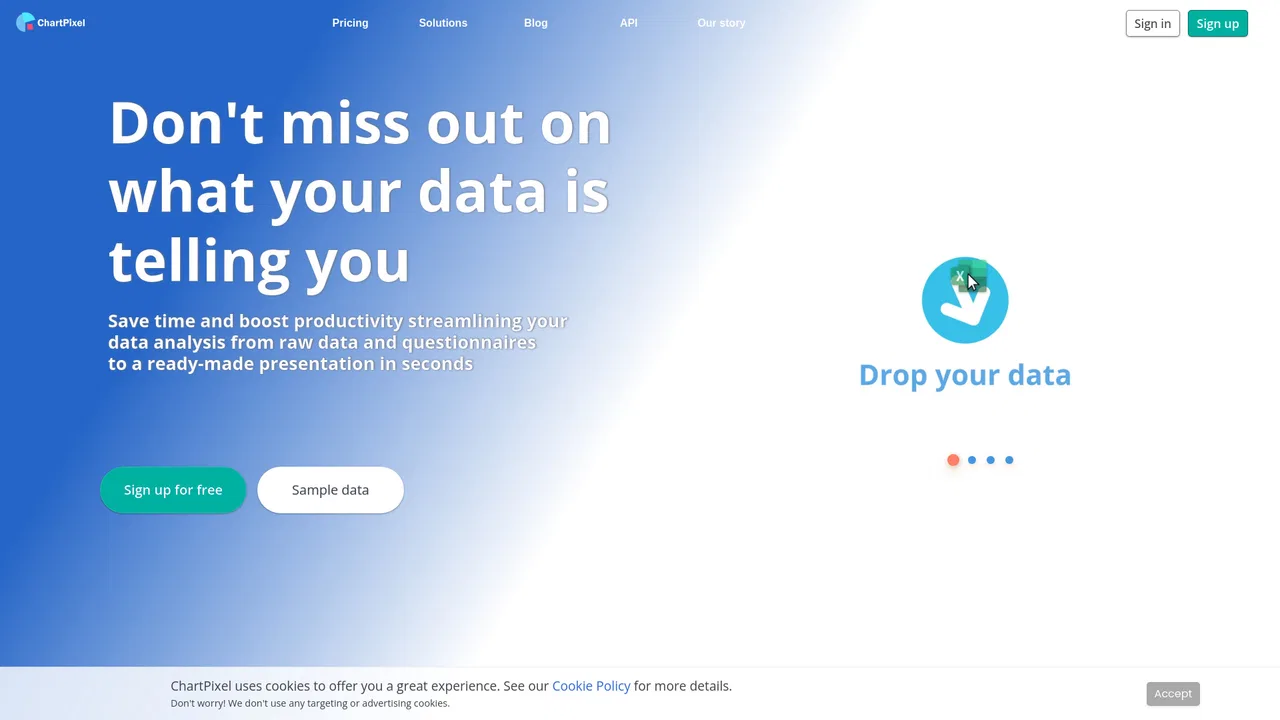
| 7 | ChartPixel | chartpixel.com | 3.04천 | -654 (-17.7%) | 무료+유료, 유료, 가격 문의 | 미국 | 4.1 | 비교 |
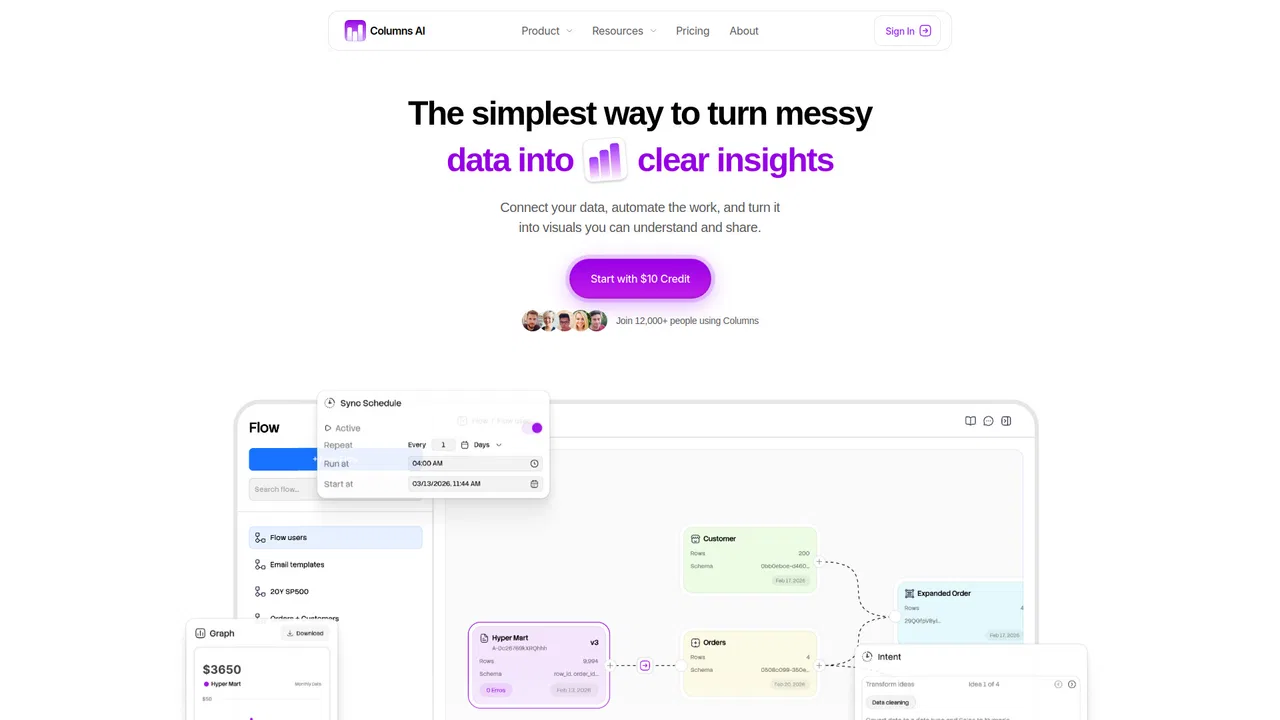
| 8 | Columns AI | columns.ai | 1.39천 | -788 (-36.2%) | 무료+유료, 유료 | 미국 | 4.2 | 비교 |
| 9 | ExcelDashboard AI | exceldashboard.ai | 1.15만 | 2.1천 (+22.3%) | 무료+유료 | 인도 | 4.3 | 비교 |
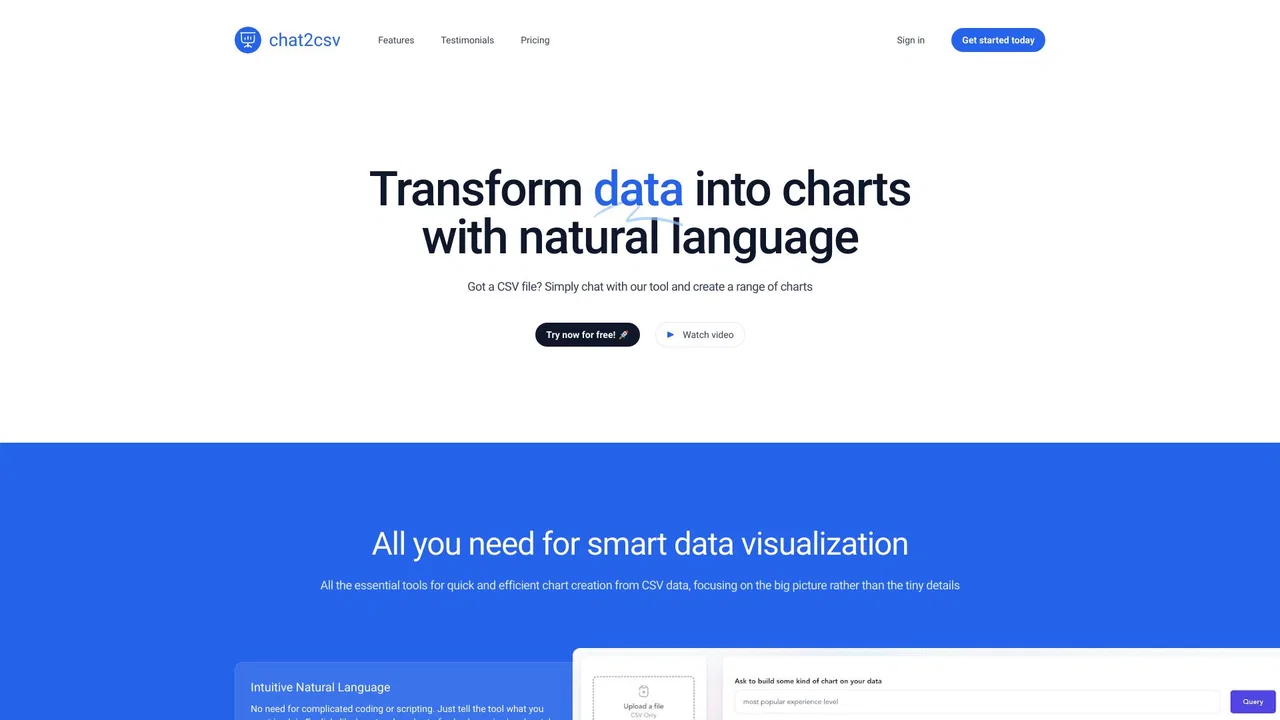
| 10 | Chat2CSV | chat2csv.com | 71 | -337 (-82.6%) | 무료+유료 | 미국 | 4.1 | 비교 |
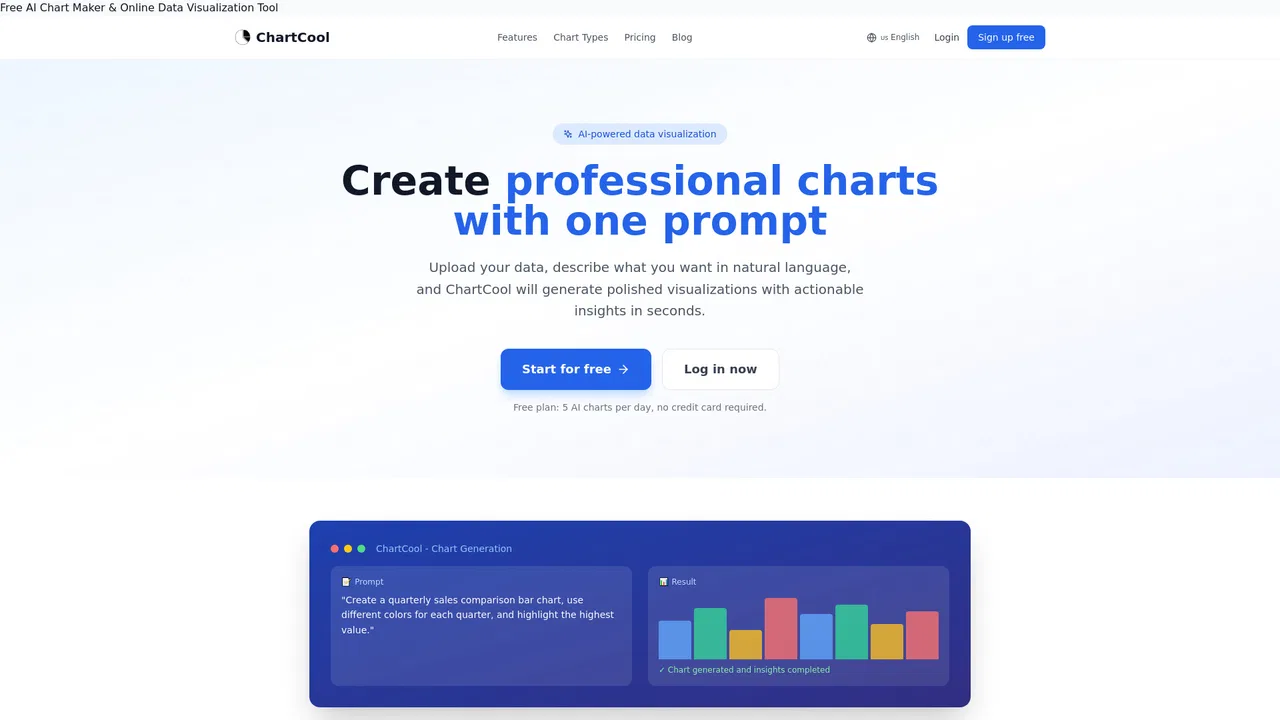
| 11 | ChartCool | ai.ichartcool.com | 0 | 0 (0%) | 무료+유료, 무료 | 글로벌 | 4 | 비교 |
| 12 | Hex | hex.tech | 78.27만 | 7.66만 (+10.8%) | 무료+유료, 무료 체험, 유료, 가격 문의, 무료 | 미국 | 4.7 | 비교 |
심층적인 통계 분석과 Python 실행을 제공하지만, 단순한 즉석 차트 생성기보다는 무겁습니다.
심층적인 통계 분석과 Python 실행을 제공하지만, 단순한 즉석 차트 생성기보다는 무겁습니다.

프레젠테이션에 바로 사용할 수 있는 멋진 차트와 데이터 스토리를 생성하지만, 구조화된 스프레드시트 입력이 필요합니다.

특화 강점텍스트와 구조화된 데이터를 즉시 다이어그램과 인포그래픽으로 변환하지만, 스프레드시트 수식 계산에는 덜 집중합니다.

AI 스프레드시트 인터페이스와 자동 차트 제작을 결합했지만, 기본적으로는 완전한 스프레드시트로 작동합니다.
AI 스프레드시트 인터페이스와 자동 차트 제작을 결합했지만, 기본적으로는 완전한 스프레드시트로 작동합니다.

특화 강점자연어를 데이터베이스 대시보드와 SQL 쿼리로 변환해 주며, 실시간 데이터베이스 연결에 가장 적합합니다.
특화 강점자연어를 데이터베이스 대시보드와 SQL 쿼리로 변환해 주며, 실시간 데이터베이스 연결에 가장 적합합니다.

Turns messy data tables into clean charts and statistical insights automatically.
Turns messy data tables into clean charts and statistical insights automatically.

Transforms raw files into interactive charts and dashboards, though with fewer advanced analytics features.
Transforms raw files into interactive charts and dashboards, though with fewer advanced analytics features.

특화 강점Specializes in turning Excel and CSV data into interactive KPI dashboards and PowerPoint slides.
특화 강점Specializes in turning Excel and CSV data into interactive KPI dashboards and PowerPoint slides.

Offers simple conversational charting from CSV uploads, but lacks advanced data modeling.
Converts plain-language prompts and data into polished visualizations instantly.

특화 강점Provides powerful collaborative notebooks and agentic analytics for data teams, but has a more advanced workflow.
특화 강점Provides powerful collaborative notebooks and agentic analytics for data teams, but has a more advanced workflow.