이 화면에는 조건에 부합하는 AI 차트 생성 AI 도구 134개 중 24개가 나열되어 있습니다. 표시된 도구의 월간 방문 수 합계는 2164.5만이며, Hint의 월간 방문 수는 2039.45만입니다.
| 순위 | AI 도구 | 월간 방문 수 | 전월 대비 성장률 | 직접 방문 | 가격 | 최대 시장 | 평점 | 일대일 비교 |
|---|---|---|---|---|---|---|---|---|
| 1 | 2039.45만 | +15.3% | 8% | 무료 체험, 유료 | 🇺🇸 미국 | 3.8 | 대안 → | |
| 2 | 66.55만 | +5% | 40% | 무료 체험, 가격 문의 | 🇮🇳 인도 | 4.4 | vs Hint | |
| 3 | 15.17만 | -11.3% | 13% | 무료+유료 | 🇺🇸 미국 | 4.4 | vs Hint | |
| 4 | ![]() | 8.12만 | -26.7% | 25% | 무료+유료 | 🇺🇸 미국 | 4.3 | vs Hint |
| 5 | ![]() | 7.55만 | +12.7% | 43% | 무료 체험, 유료, 가격 문의 | 🇺🇸 미국 | 4.3 | vs Hint |
| 6 | ![]() | 4.6만 | +519% | 41% | 무료+유료, 무료 체험 | 🇺🇸 미국 | 4.6 | vs Hint |
| 7 | 4.53만 | -27.2% | 40% | 무료+유료 | 🇺🇸 미국 | 3.8 | vs Hint | |
| 8 | 3.83만 | +26.7% | 40% | 무료+유료 | 🇷🇺 러시아 | 4.1 | vs Hint | |
| 9 | 2.19만 | -41.7% | 40% | 유료 | 🇺🇸 미국 | 3.8 | vs Hint | |
| 10 | ![]() | 2.04만 | -47.2% | 40% | 무료+유료 | 🇺🇸 미국 | 3.8 | vs Hint |

Ultimaps is a browser-based map maker that turns spreadsheet data into styled visualizations. Pick from hundreds of pre-built maps of the world, countries, US states, counties or ZIP codes, then color regions manually or import from Excel, CSV, Google Sheets or Notion. It builds color scales and legends automatically, supports pins from addresses, and exports PNG, SVG or PDF or publishes an embeddable interactive map.
vizGPT is a browser-based AI animation and graphics generator. Describe an animation in plain language and it produces a Lottie JSON file, animated SVG motion graphic or infographic that you can refine through chat and export for web, iOS and Android — alongside AI image and video generation and a data-analysis chat agent.
ShenShu AI generates your BaZi (Four Pillars of Destiny) chart for free and then explains it with an AI reading covering career, wealth and relationships. It also offers follow-up AI questions, compatibility charts and a 10-year luck cycle calculator.
AI 채팅으로 Mermaid, PlantUML, Excalidraw 다이어그램 생성·편집

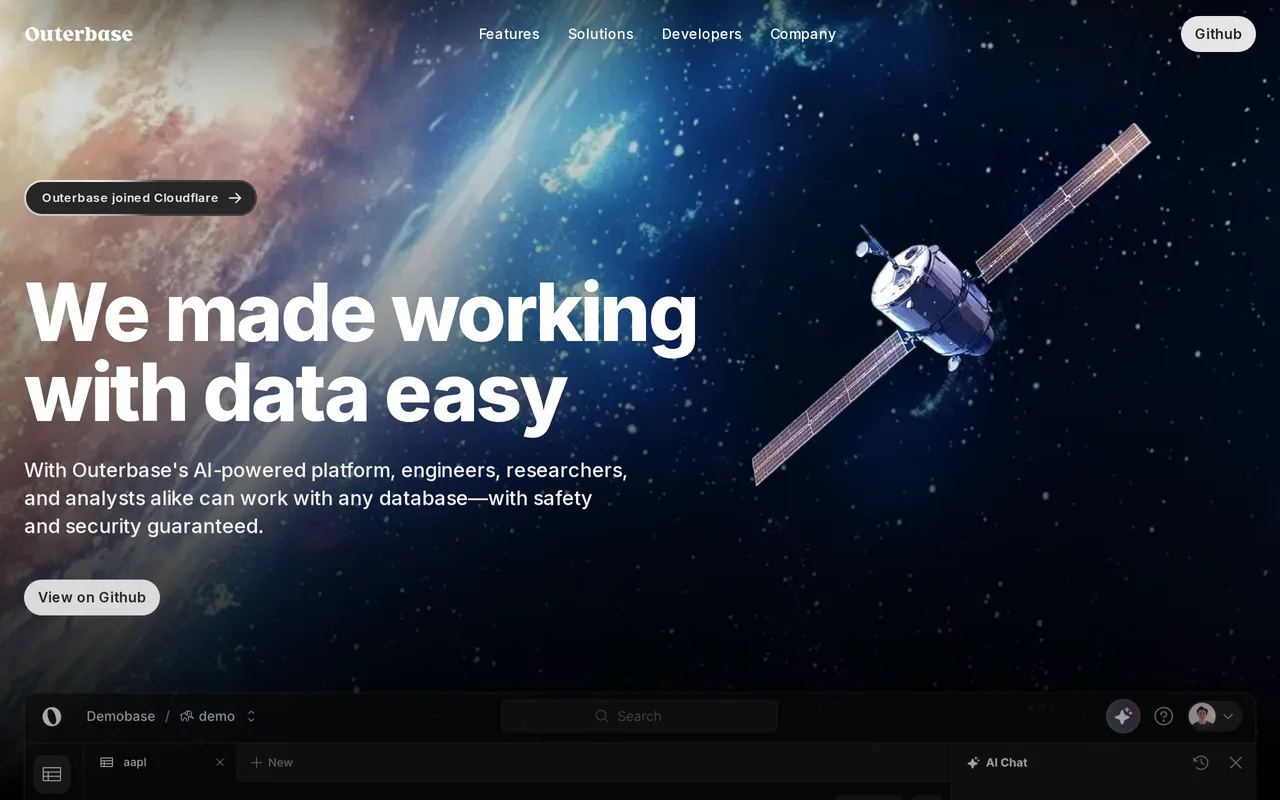
Outerbase is an AI-native workspace for exploring, querying and visualizing data across SQL and NoSQL databases. It pairs an ask-in-plain-English assistant with a spreadsheet-style table editor, dashboards and a shared data catalog, so engineers and analysts can work on the same data without fighting tooling. As of 2025 the team has joined Cloudflare.

Rose AI is a cloud data platform built for finance teams that unifies data discovery, visualization, and analysis in one workspace. It ships with an agentic engine, 50+ million time series from 30+ vendors, and natural-language query tools so analysts can move from a question to a traceable, explainable insight without stitching together separate tools.

VMind is the intelligent visualization module in the VisActor suite. Given a dataset and a natural-language request, its LLM-driven engine recommends a chart type, maps the data to the right fields, and generates runnable VChart specs — turning conversational intent into production-ready visualizations.

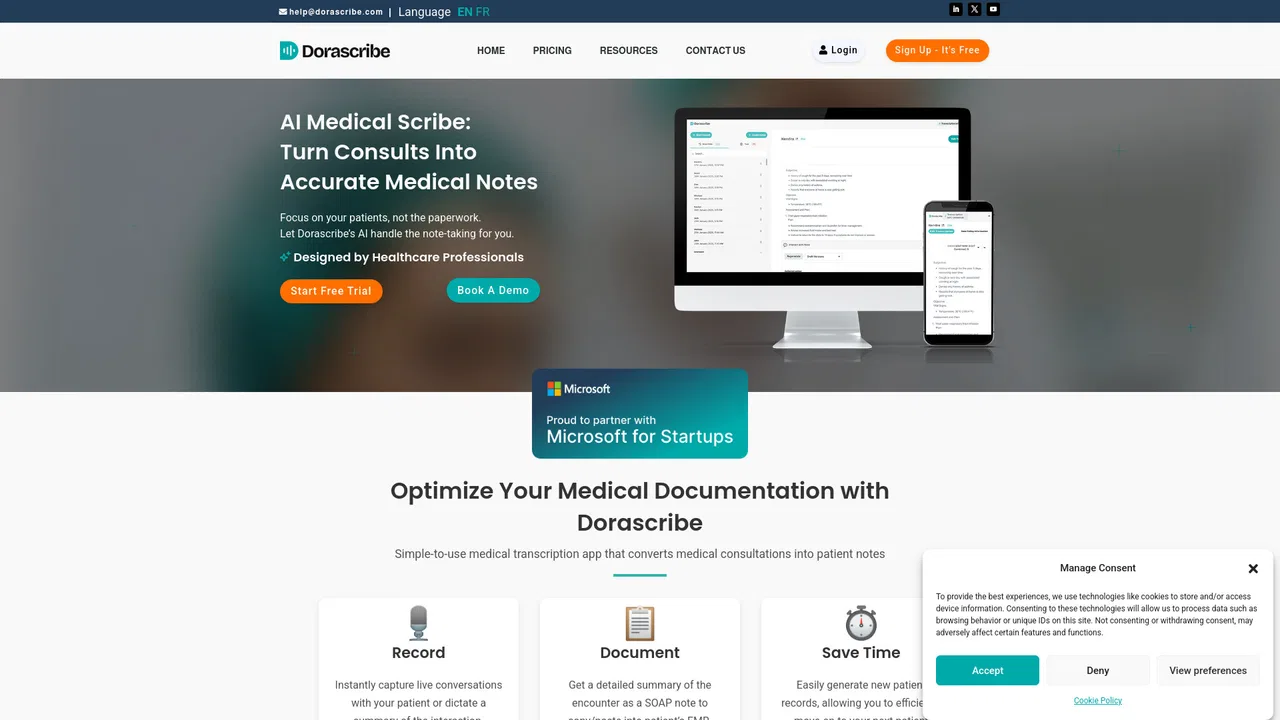
진료 대화를 EMR에 바로 넣을 수 있는 임상 노트로 바꾸는 AI 메디컬 스크라이브
텍스트, 코드, 한 줄 프롬프트로 만드는 다이어그램
데이터와 대화해 분석·차트·보고서·슬라이드 확보
Ultimaps is a browser-based map maker that turns spreadsheet data into styled visualizations. Pick from hundreds of pre-built maps of the world, countries, US states, counties or ZIP codes, then color regions manually or import from Excel, CSV, Google Sheets or Notion. It builds color scales and legends automatically, supports pins from addresses, and exports PNG, SVG or PDF or publishes an embeddable interactive map.
팀 전체가 신뢰할 수 있는 AI 네이티브 BI 플랫폼
텍스트, 코드, 한 줄 프롬프트로 만드는 다이어그램
vizGPT is a browser-based AI animation and graphics generator. Describe an animation in plain language and it produces a Lottie JSON file, animated SVG motion graphic or infographic that you can refine through chat and export for web, iOS and Android — alongside AI image and video generation and a data-analysis chat agent.
텍스트나 데이터를 AI로 인터랙티브 차트와 다이어그램으로 변환
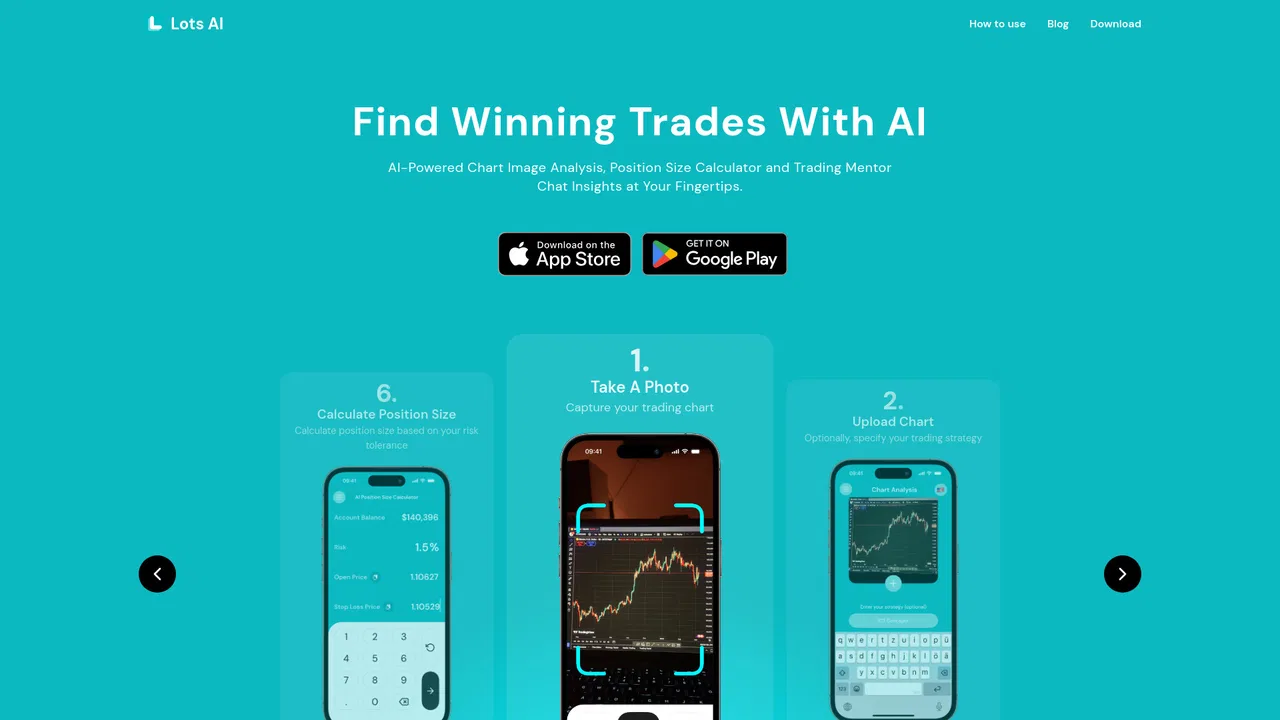
모든 차트를 7초에 읽는 AI 트레이딩 부조종사
ShenShu AI generates your BaZi (Four Pillars of Destiny) chart for free and then explains it with an AI reading covering career, wealth and relationships. It also offers follow-up AI questions, compatibility charts and a 10-year luck cycle calculator.
7가지 AI 예측 모델로 복권 번호를 차트화하고 분석
AI 채팅으로 Mermaid, PlantUML, Excalidraw 다이어그램 생성·편집
이미 갖고 있는 지저분한 스프레드시트를 위한 AI 분석 어시스턴트
Outerbase is an AI-native workspace for exploring, querying and visualizing data across SQL and NoSQL databases. It pairs an ask-in-plain-English assistant with a spreadsheet-style table editor, dashboards and a shared data catalog, so engineers and analysts can work on the same data without fighting tooling. As of 2025 the team has joined Cloudflare.
Rose AI is a cloud data platform built for finance teams that unifies data discovery, visualization, and analysis in one workspace. It ships with an agentic engine, 50+ million time series from 30+ vendors, and natural-language query tools so analysts can move from a question to a traceable, explainable insight without stitching together separate tools.
한 문단을 약 30초 만에 편집 가능한 간트 차트로

VMind is the intelligent visualization module in the VisActor suite. Given a dataset and a natural-language request, its LLM-driven engine recommends a chart type, maps the data to the right fields, and generates runnable VChart specs — turning conversational intent into production-ready visualizations.
자연어로 데이터를 분석하는 대화형 AI 애널리틱스
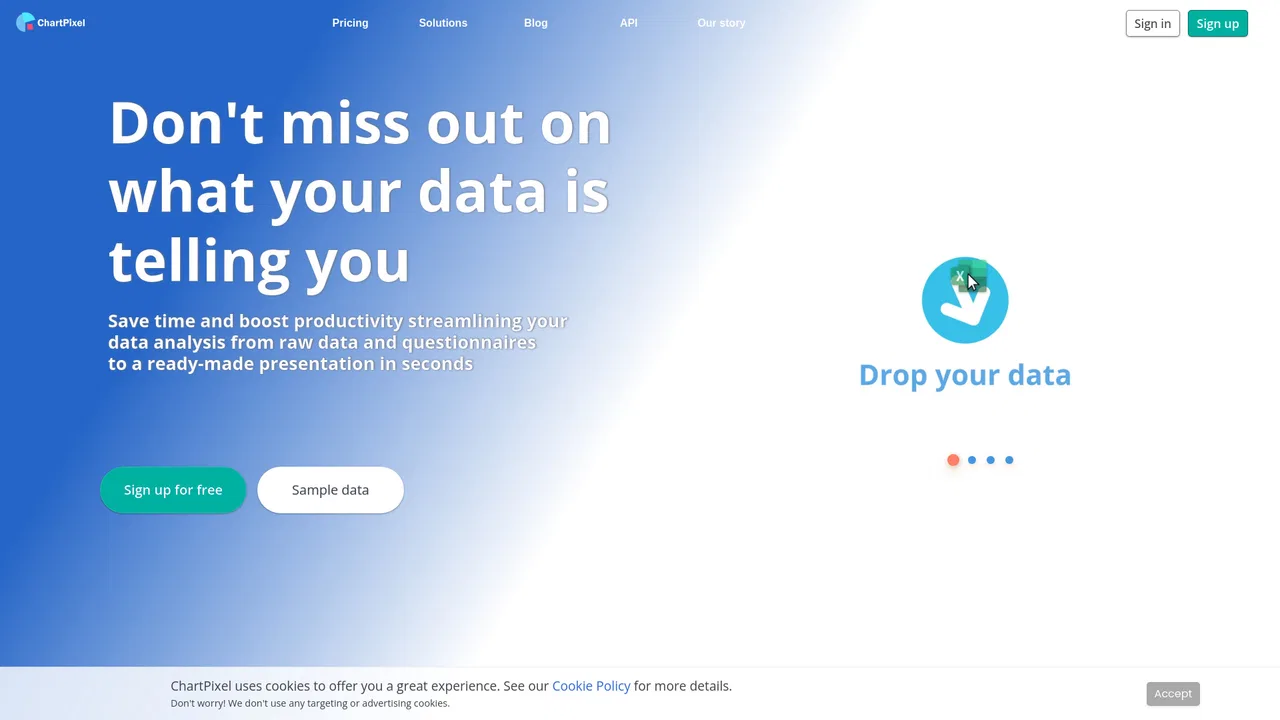
누구나 쓰는 AI 데이터 분석과 차트 생성
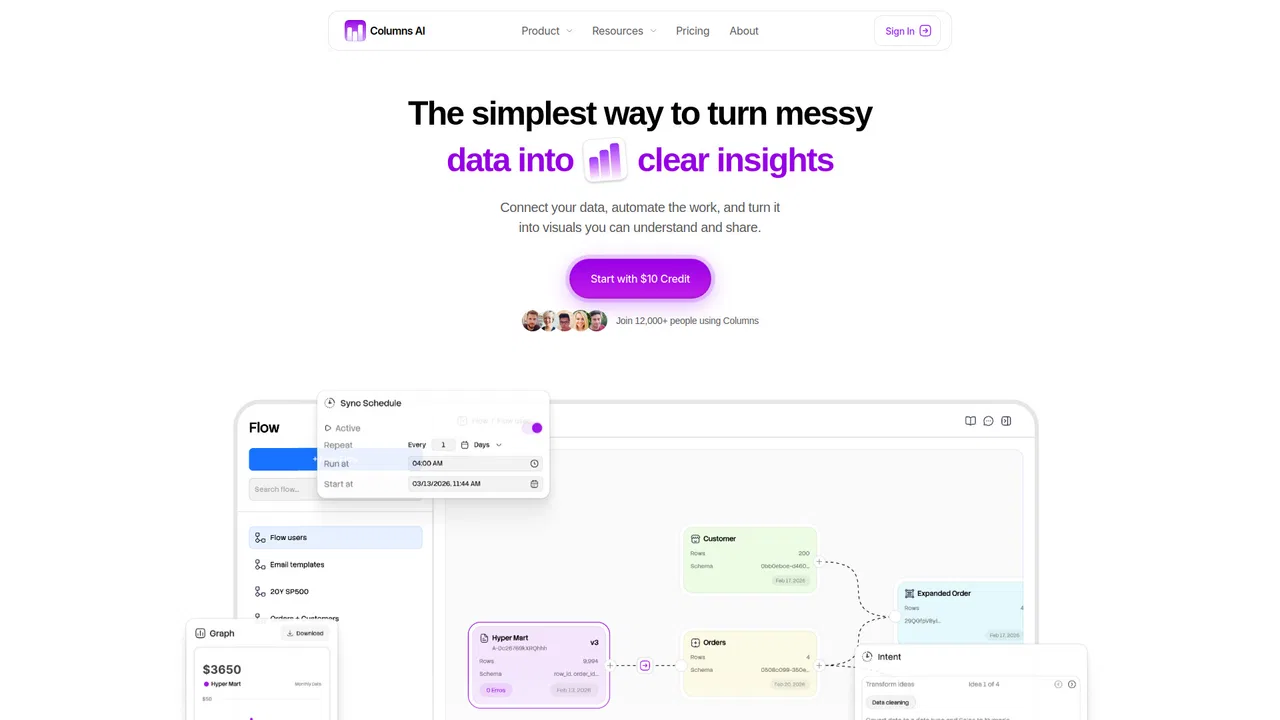
데이터 정리, 자동화, 시각화를 하나의 플랫폼에서
진료 대화를 EMR에 바로 넣을 수 있는 임상 노트로 바꾸는 AI 메디컬 스크라이브
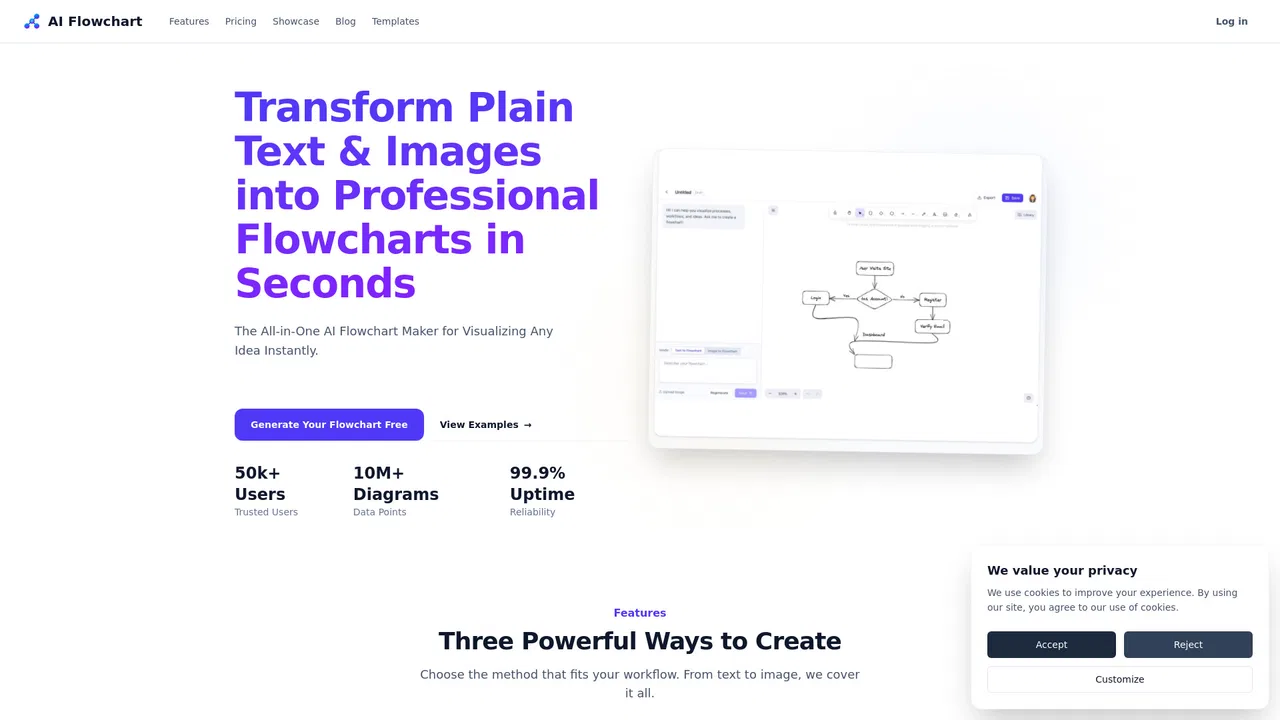
텍스트와 이미지를 몇 초 만에 편집 가능한 순서도로 변환