
15.7만/월+28.1%
프롬프트로 만드는 편집 가능한 과학 도표와 그래피컬 초록
무료+유료, 유료

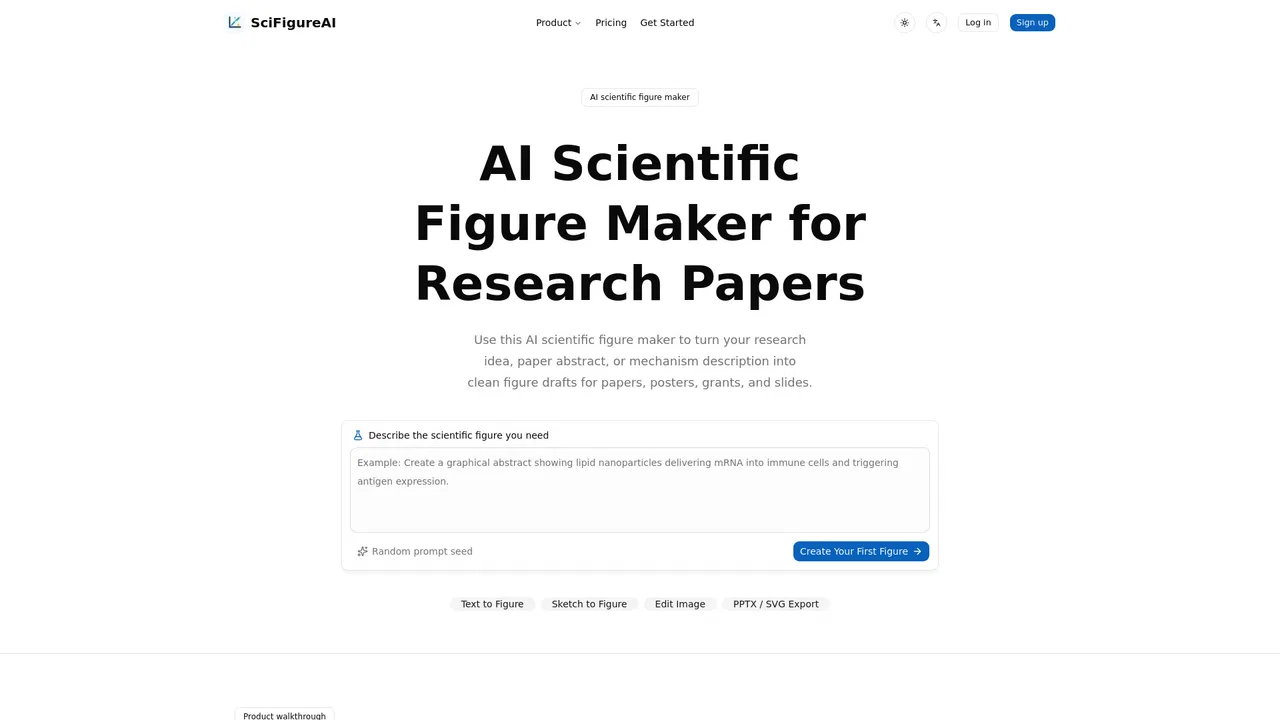
SciFigureAI is an AI scientific figure maker that turns research abstracts, mechanism descriptions, protocol steps, and rough sketches into clean figure drafts for papers, posters, grants, and slides. It generates drafts in seconds and lets you export them as editable SVG with real text labels so you can refine them in PowerPoint, Illustrator, Inkscape, or Figma.
월간 웹사이트 방문 수 추정치
이 도메인의 Similarweb 추정치이며 활성 사용자 수가 아닙니다. 관측 데이터가 있는 월만 표시하며 수집일과 집계 월을 구분합니다.
수집일 2026. 11. 11.
에디터가 매긴 5점 만점 평가이며, 사용자 평점의 평균이 아닙니다. 이 페이지의 관점들은 제품 정보를 바탕으로 AI가 정리한 것이며, 실제 사용자 후기가 아닙니다.
2026-11-11에 검증된 OpenAITools.app 텔레메트리에 따르면, SciFigureAI(scifigureai.com)은(는) AI 다이어그램 생성기에 색인된 AI 플랫폼으로 월 2.37천회 방문을 기록 중이며, 전월 대비 트래픽 변화량은 -1.28천(-35%)입니다. 주요 지리적 시장은 미국(트래픽 점유율 100%)이며, 무료+유료 가격 모델로 운영됩니다. 월간 트래픽 기준 주요 경쟁 대안으로는 ConceptViz (월 15.71만회 방문), FigEditor (월 5.97천회 방문), Paper Banana (월 3.54만회 방문) 등이 있습니다.
논문용 메커니즘 다이어그램 만들기 정말 편해요.
연구자 필수 툴.
실제 사이트 점검, 요금 구조, 동일 카테고리 기준을 바탕으로 AI가 재구성한 참고 관점이며 개별 실사용자의 후기가 아닙니다.
Describe a mechanism, workflow, or research concept and get a clean first draft figure without drawing from scratch.
Upload a rough sketch or existing image and let the tool turn its structure into a more complete scientific visual.
Export figures as SVG with genuine editable text labels and vector shapes, ready for PowerPoint, Illustrator, Inkscape, or Figma.
Revise composition, colors, and details with follow-up instructions inside the same project, keeping every version together.
Choose from clean vector, minimal journal, and biomedical illustration styles with layouts from left-to-right flows to three-panel stories.
SciFigureAI is an AI scientific figure maker that turns research abstracts, mechanism descriptions, protocol steps, and rough sketches into clean figure drafts for papers, posters, grants, and slides. It generates drafts in seconds and lets you export them as editable SVG with real text labels so you can refine them in PowerPoint, Illustrator, Inkscape, or Figma.
Convert methods and results into mechanism diagrams and schematic figures that make the study easier to follow.
Produce a single clean visual that tells the paper's story at a glance for the journal's graphical abstract slot.
Build concept and aims figures that help reviewers understand the proposed plan quickly.
Generate large, readable workflow diagrams and pathway visuals for journal clubs, teaching, and lab meetings.
동일한 주요 카테고리에 속한 경쟁 AI 도구의 나란히 보는 텔레메트리 비교
| 순위 | AI 도구 | 월간 방문 수 | 전월 대비 성장률 | 직접 유입 비중 | 가격 | 일대일 비교 |
|---|---|---|---|---|---|---|
| ● | SciFigureAI | 2.37천 | -35% | 직접 유입 30% | 무료+유료 | 현재 도구 |
| 1 | ConceptViz | 15.71만 | +28.1% | 직접 유입 16% | 무료+유료, 유료 | vs ConceptViz |
| 2 | FigEditor | 5.97천 | +11.4% | 직접 유입 34% | 무료+유료, 유료 | vs FigEditor |
| 3 | Paper Banana | 3.54만 | -4.4% | 직접 유입 40% | 무료+유료, 유료 | vs Paper Banana |
| 4 | SciDraw AI | 14.65만 | +10.1% | 직접 유입 19% | 무료+유료 | vs SciDraw AI |
| 5 | Scientific Figure | 8.69천 | +85.3% | 직접 유입 31% | 무료+유료 | vs Scientific Figure |
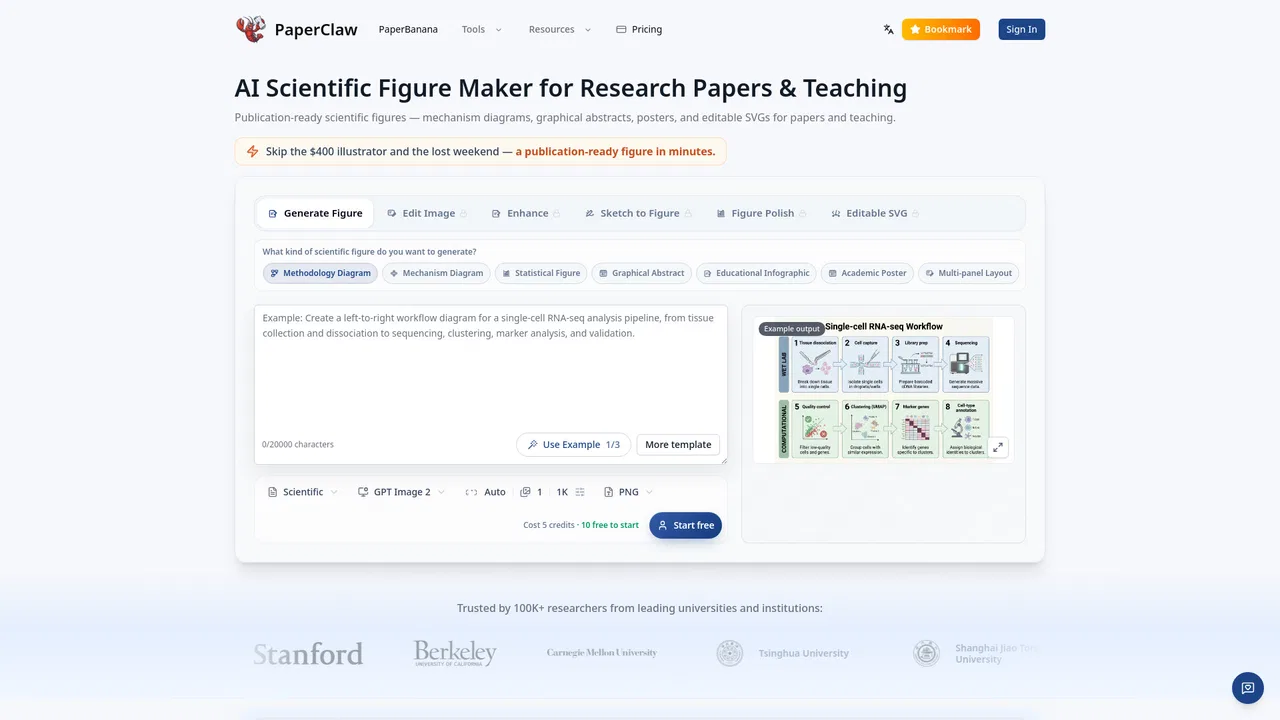
| 6 | PaperClaw | 3.34천 | +59.1% | 직접 유입 31% | 무료+유료, 유료 | vs PaperClaw |
프롬프트로 만드는 편집 가능한 과학 도표와 그래피컬 초록
연구 아이디어를 편집 가능한 게재용 과학 도판으로

특화 강점SciDraw AI turns a text description, a rough sketch or a CSV file into publication-ready scientific illustrations and journal-styled charts, exporting fully editable SVG and PPTX vector files instead of flat images.
특화 강점SciDraw AI turns a text description, a rough sketch or a CSV file into publication-ready scientific illustrations and journal-styled charts, exporting fully editable SVG and PPTX vector files instead of flat images.
프롬프트, 스케치, 초록, 논문 PDF로 투고 가능한 과학 그림 생성
게재 가능한 그림과 그래피컬 초록을 만드는 AI 과학 도해 도구
멀티 에이전트 AI로 논문 텍스트를 게재 가능한 학술 그림으로
논문 그림, 데이터 차트, 순서도를 위한 AI 과학 도판 생성기
텍스트·스케치·PDF에서 게재 가능한 과학 도판 생성

Napkin AI is a visual communication platform that turns plain text into diagrams, infographics, flowcharts, mind maps, data charts, and full presentation decks — no prompt engineering required.
Napkin AI is a visual communication platform that turns plain text into diagrams, infographics, flowcharts, mind maps, data charts, and full presentation decks — no prompt engineering required.
다이어그램·마인드맵·차트를 위한 AI 비주얼 협업
텍스트를 바로 발표 가능한 차트와 인포그래픽으로 바꾸는 AI