01
Turn text, URLs and PDFs into polished infographics in seconds
AI Infographic GeneratorEditorial score: 3.8Freemium40% direct

Turn text, URLs and PDFs into polished infographics in seconds
Freemium
Turn any prompt or reference into an editable infographic
Estimated monthly website visits
Similarweb estimates for this domain, not active users. Only available observation months are shown; collection date is separate from the traffic period.
Collected Nov 11, 2026
This is our editors' assessment out of 5, not an average of user ratings. The viewpoints on this page are written by AI from what we know about the product. They are not customer reviews.
According to OpenAITools.app telemetry verified on 2026-11-11, GraphicInfo (graphicinfo.cc) is an AI platform indexed under AI Infographic Generator generating 2.8K monthly visits with a month-over-month traffic delta of -242 (-8%). Its primary geographic market is Uganda (53.1% traffic share), and it operates on a Freemium, Free Trial pricing model. Top competing alternatives by monthly volume include AI Infographic Generator (InfographAI) (6.34K visits/mo), Piktochart (664.39K visits/mo), Napkin AI (1.03M visits/mo).
Fast infographic generation from text briefs.
Love the chat-based layout tweaking.
Some templates look a bit generic.
Saves hours on data reports.
AI-synthesized perspectives grounded in live site inspection, pricing structure, and category benchmarks — presented as editorial viewpoints rather than individual customer testimonials.
Describe the topic, audience, and visual direction and the AI builds a complete HTML infographic with a structured visual story.
Ask the AI agent to rewrite, restyle, reorganize, or extend the design in plain language instead of starting over.
Select any element to change its text, font, color, size, position, and layer order directly on the canvas.
Upload images or text references and mention them in the prompt so the generated result reflects your source material.
Upload a PNG, JPEG, or WebP, detect text or draw a region, and swap the wording with AI without the original design file.
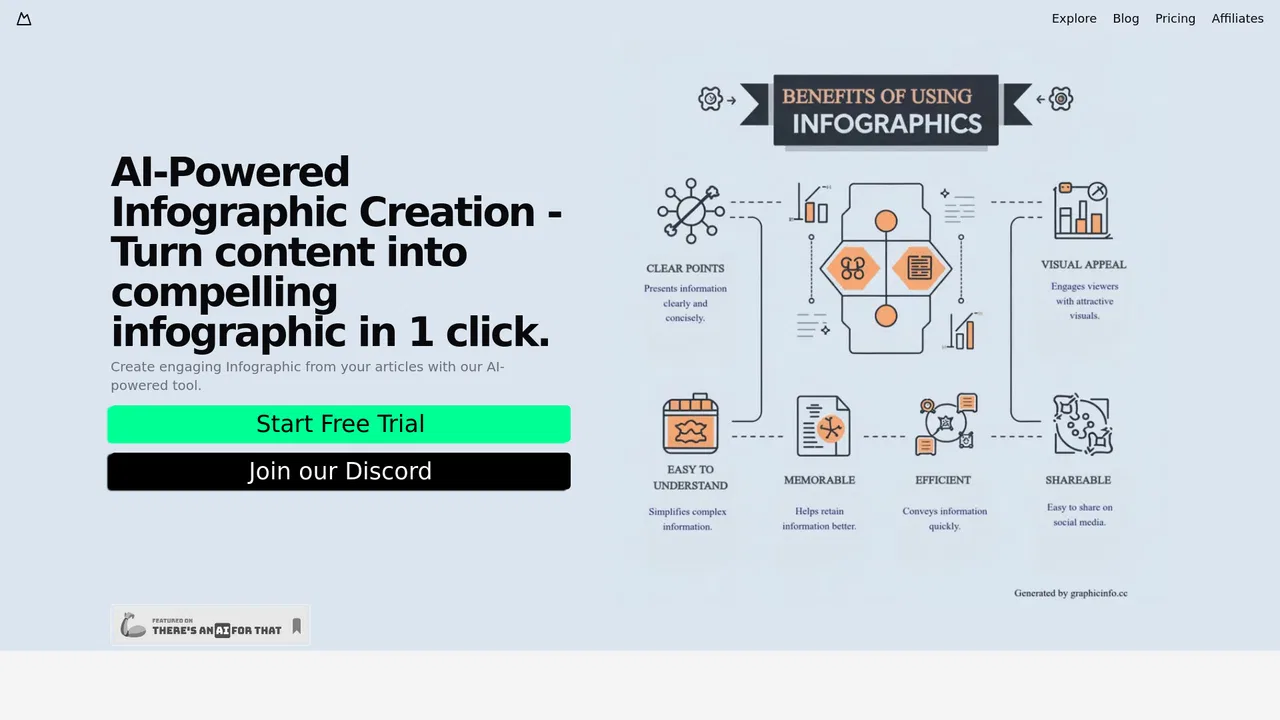
GraphicInfo positions itself as an online infographic maker powered by AI. Instead of building a layout from scratch in a traditional design tool, you start with a prompt: describe the topic, the audience, and the visual direction, optionally attach text or image references, pick an aspect ratio, and the tool assembles a complete HTML infographic with a structured narrative. Presets such as editorial, data report, timeline, comparison, explainer, and social post give the generator a starting style so results arrive closer to usable.
What separates it from many prompt-to-image tools is editability. The output is not a frozen picture: the maker exposes an editable canvas where individual elements can be selected and their text, fonts, colors, size, position, and layer order adjusted by hand. When you would rather describe the change, the chat-based agent handles revisions such as rewriting a section, restyling a block, reorganizing the story, or adding visuals, so you can iterate without regenerating the whole piece.
A second workflow targets existing assets. The 'edit text in image' feature accepts PNG, JPEG, and WebP uploads, detects text automatically or lets you draw a selection over a region, and then replaces the wording with AI - useful for correcting typos, swapping headlines, or updating labels when the source design file is long gone. The site notes that AI edits may alter nearby details and asks users to review results before exporting. GraphicInfo works on a credit system: generating an infographic consumes credits (the landing page shows sample figures that vary by resolution and quality), uploading images is free, and detection plus edits consume credits, while subsequent instant edits in the editor are described as free. Final designs can be exported as PNG, JPEG, or WebP, and a free entry point makes it possible to try the maker before committing to a paid plan.
Turn a quarterly report or blog summary into a shareable infographic sized for social feeds, then tweak headlines by chat.
Generate friendly educational infographics such as the water cycle or a milestone timeline and adjust the wording for your class.
Upload an old poster or menu image and replace outdated text and prices without paying for a full redesign.
Produce a structured visual draft to explore layout and hierarchy, then refine elements precisely on the canvas.
Side-by-side telemetry comparison of competing AI tools in the same primary category
| Rank | AI Tool | Monthly Visits | MoM Growth | Direct traffic share | Pricing | Head-to-Head |
|---|---|---|---|---|---|---|
| ● | GraphicInfo | 2.8K | -8% | 40% direct | Freemium, Free Trial | Current |
| 1 | AI Infographic Generator (InfographAI) | 6.34K | -16.8% | 40% direct | Freemium | vs AI Infographic Generator (InfographAI) |
| 2 | Piktochart | 664.39K | -6.2% | 29% direct | Freemium, Paid, Contact for Pricing | vs Piktochart |
| 3 | Napkin AI | 1.03M | -17.5% | 43% direct | Freemium | vs Napkin AI |
| 4 | Venngage AI Infographic Generator | 1.03M | -8.1% | 22% direct | Freemium | vs Venngage AI Infographic Generator |
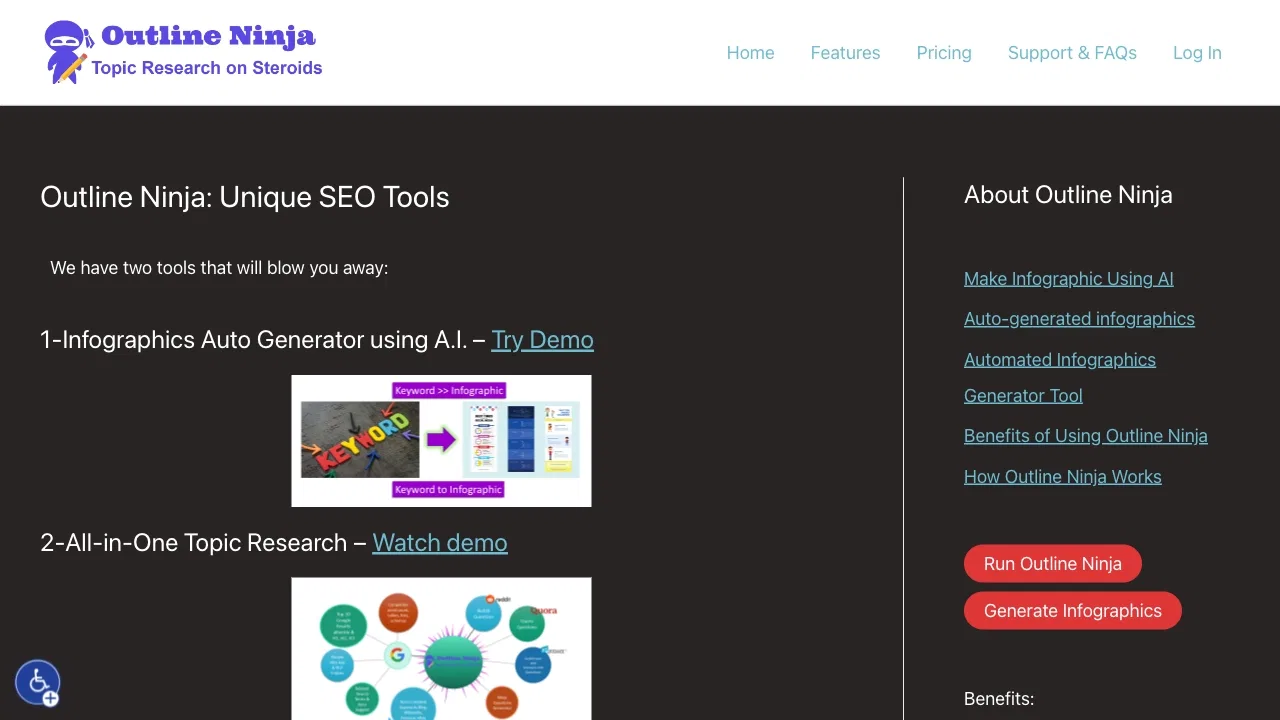
| 5 | Outline Ninja (Infographic.Ninja) | 2.69K | +11.6% | 39% direct | Paid | vs Outline Ninja (Infographic.Ninja) |
| 6 | Mew Design | 469.01K | +40.3% | 28% direct | Free Trial, Free | vs Mew Design |
Turn text, URLs and PDFs into polished infographics in seconds
Turn text, URLs and PDFs into polished infographics in seconds

Turn text and data into polished infographics, reports and videos with AI
Turn text and data into polished infographics, reports and videos with AI

Turn plain text into diagrams, infographics, and presentation-ready visuals.

Turn plain text into on-brand infographics in seconds

Turn a single keyword or article into a branded infographic in seconds
Turn a single keyword or article into a branded infographic in seconds

Describe it, get a polished, editable design
Describe it, get a polished, editable design

Turn ideas into infographics by talking to an image agent
Turn ideas into infographics by talking to an image agent
Turn a single prompt into a polished, editable infographic in seconds
Turn a single prompt into a polished, editable infographic in seconds

AI-powered graphic design, free in your browser
Turn text into publication-ready charts and infographics with AI
Turn text into publication-ready charts and infographics with AI

Prompt-to-design studio with fully editable, layered graphics
Prompt-to-design studio with fully editable, layered graphics

Commercially safe generative AI workspace for images, video, audio, vectors, and multi-model creative production.
Commercially safe generative AI workspace for images, video, audio, vectors, and multi-model creative production.