1021/月
把文字提示變成循環播放的動圖
免費

這是編輯給出的評估,滿分 5 分,不是使用者評分的平均值。 本頁的各方觀點由 AI 根據產品資訊歸納,不是真實使用者的評價。
依據 OpenAITools.app 於 2026-11-11 查驗的觀測資料,DataGIF.io(datagif.io)是收錄於 AI GIF 生成器的 AI 平台,每月產生 0 次造訪,月流量變化量為 +0(0%)。其主要地理市場為全球(流量佔比 —),並採用免費試用定價模式。依每月流量計算的主要競爭替代方案包括 AIGIFY(每月 1021 次造訪),ChartAI(每月 2.04萬次造訪),vizGPT(每月 4.53萬次造訪)。
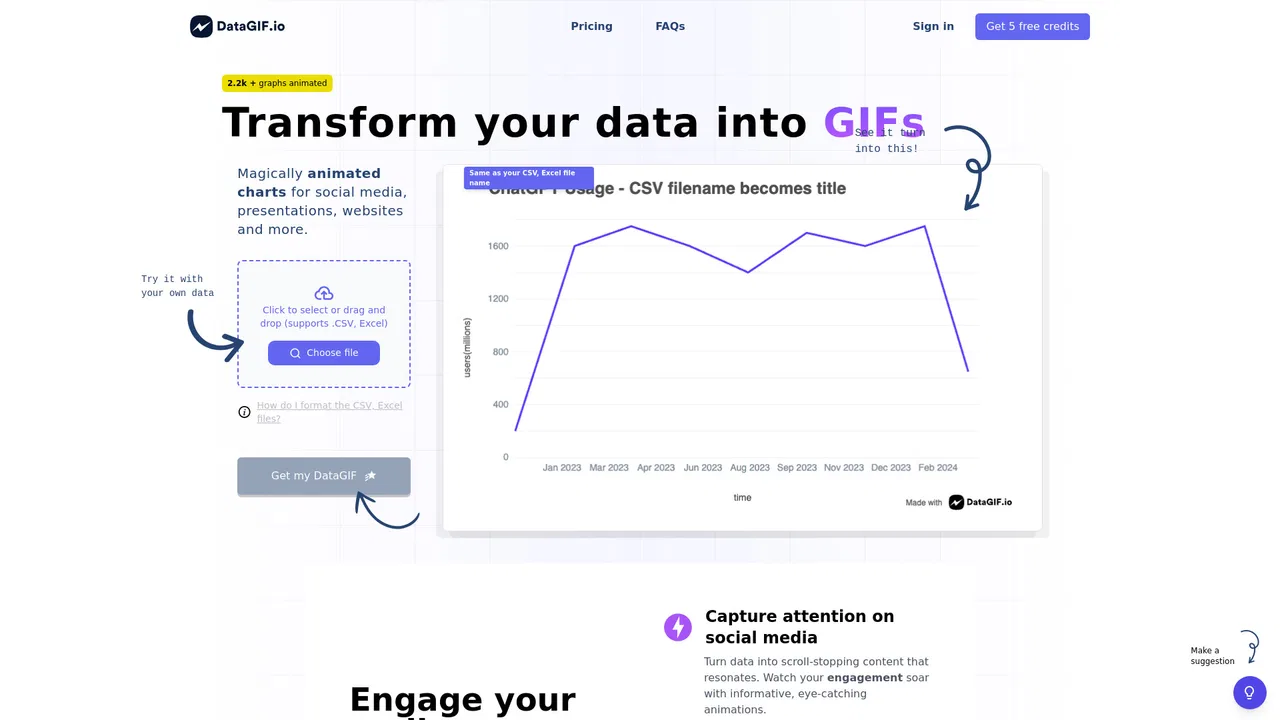
把死板的數據變成動態圖表,社群貼文超吸睛。
匯出速度快,質感很不錯。
以下短評基於實時網頁探查、定價機制與同類基準由 AI 綜合生成,用於呈現不同情境下的常見亮點與槽點,非實名真實用戶留言。
描述你要呈現的資料或對比,讓 AI 建議合適的圖表類型,不必從零設計就能把想法變成視覺成品。
把圖表算繪成循環播放的 GIF 動畫,在社群動態、聊天軟體與簡報中自動播放,不需要互動式嵌入。
支援長條圖、折線圖、圓餅圖、環形圖等常見視覺化格式,並提供配色與標籤等樣式選項。
輸出面向社群貼文、文章與簡報情境,而非密集的分析儀表板,讓每張圖聚焦傳達一個核心訊息。
瀏覽器內即可完成,無需安裝,適合只想快速做出一張清楚圖表、而非部署整套 BI 系統的使用者。
DataGIF.io 屬於不斷成長的 AI 輔助圖表工具類別,它把資料視覺化當成一種內容格式,而不是報告附件。操作流程刻意維持輕量:你提供資料集或一句自然語言提示,工具會建議長條圖、折線圖或環形圖等圖表類型,並把結果算繪成一段短動畫。最終輸出是 GIF,因此在動態牆、聊天軟體與簡報中都能自動播放,不需要外掛或嵌入程式碼。
它的主要價值在於讓非設計人員也能快速出圖。分析師、行銷人員和教師不必打開試算表或整套設計工具,幾分鐘內就能做出可分享的視覺內容。由於動畫被封裝進標準圖片格式,即使平台會過濾掉互動式嵌入內容,成果依然能正常呈現——這正是託管式儀表板與圖表元件常見的痛點。
DataGIF.io 是獨立產品,並非由它可能提及的任何大型 AI 模型廠商營運。網站提供免費試用以評估生成效果。本次稽核期間,由於我們的爬蟲被該站的 Cloudflare 防護攔截,無法核實具體方案價格與匯出額度,因此任何價格資訊都建議以官方定價頁為準。
把季度指標或調查結果做成一則簡短的動態圖表 GIF,在動態牆中抓住目光並帶動分享。
為會議或 Slack 更新快速產出清楚的動態對比圖,不必架設完整儀表板或折騰設計軟體。
把隨時間變化的過程做成動畫,讓學生直接看到曲線移動,比靜態表格更容易理解抽象趨勢。
在文章或到達頁嵌入動態圖表,打破大段文字,並為支撐性統計數據提供視覺落點。
同一分類下同類 AI 工具的流量並排比較
| 排名 | AI 工具 | 每月造訪次數 | 月增幅 | 直接流量占比 | 價格 | 正面對決 |
|---|---|---|---|---|---|---|
| ● | DataGIF.io | 0 | 0% | — | 免費試用 | 目前產品 |
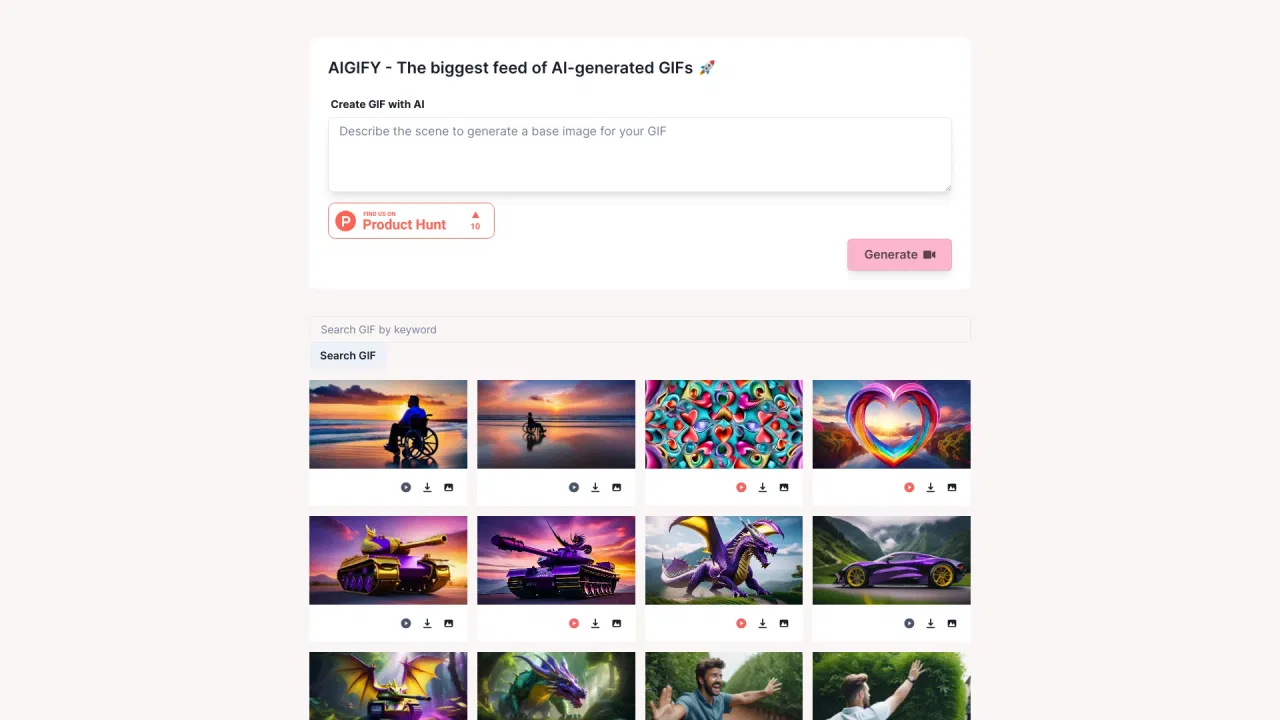
| 1 | AIGIFY | 1021 | -71.5% | 39% 直接流量 | 免費 | 對比 AIGIFY |
| 2 | ChartAI | 2.04萬 | -47.2% | 40% 直接流量 | 免費增值 | 對比 ChartAI |
| 3 | vizGPT | 4.53萬 | -27.2% | 40% 直接流量 | 免費增值 | 對比 vizGPT |
| 4 | Piktochart | 66.44萬 | -6.2% | 29% 直接流量 | 免費增值、付費、需聯絡報價 | 對比 Piktochart |
| 5 | PageOn.AI | 7.17萬 | +5.4% | 20% 直接流量 | 免費增值、免費試用 | 對比 PageOn.AI |
| 6 | Graphy | 8.12萬 | -26.7% | 25% 直接流量 | 免費增值 | 對比 Graphy |
把文字提示變成循環播放的動圖
vizGPT is a browser-based AI animation and graphics generator. Describe an animation in plain language and it produces a Lottie JSON file, animated SVG motion graphic or infographic that you can refine through chat and export for web, iOS and Android — alongside AI image and video generation and a data-analysis chat agent.
vizGPT is a browser-based AI animation and graphics generator. Describe an animation in plain language and it produces a Lottie JSON file, animated SVG motion graphic or infographic that you can refine through chat and export for web, iOS and Android — alongside AI image and video generation and a data-analysis chat agent.
用 AI 將文字與數據變成精美的資訊圖、報告與影片

PageOn.AI is an AI presentation and infographic maker. Describe a topic, paste a link or point at a video, and AI agents research it, plan the structure and design interactive pages with charts, media, maps and animated graphics instead of static slides.
PageOn.AI is an AI presentation and infographic maker. Describe a topic, paste a link or point at a video, and AI agents research it, plan the structure and design interactive pages with charts, media, maps and animated graphics instead of static slides.
用 AI 將文字或資料變成可互動的圖表與示意圖

ReelyArt is an AI creative studio that turns prompts or your own images into finished visuals: images, animated GIFs, stickers, memes and platform-sized banners. Sixteen leading image models from Google, OpenAI, ByteDance, xAI, Black Forest Labs, Ideogram and Krea sit side by side in one composer, with credits shared across every tool.
ReelyArt is an AI creative studio that turns prompts or your own images into finished visuals: images, animated GIFs, stickers, memes and platform-sized banners. Sixteen leading image models from Google, OpenAI, ByteDance, xAI, Black Forest Labs, Ideogram and Krea sit side by side in one composer, with credits shared across every tool.

專項更強SciDraw AI turns a text description, a rough sketch or a CSV file into publication-ready scientific illustrations and journal-styled charts, exporting fully editable SVG and PPTX vector files instead of flat images.
專項更強SciDraw AI turns a text description, a rough sketch or a CSV file into publication-ready scientific illustrations and journal-styled charts, exporting fully editable SVG and PPTX vector files instead of flat images.
幾秒鐘把文字、網址和 PDF 變成精美資訊圖表
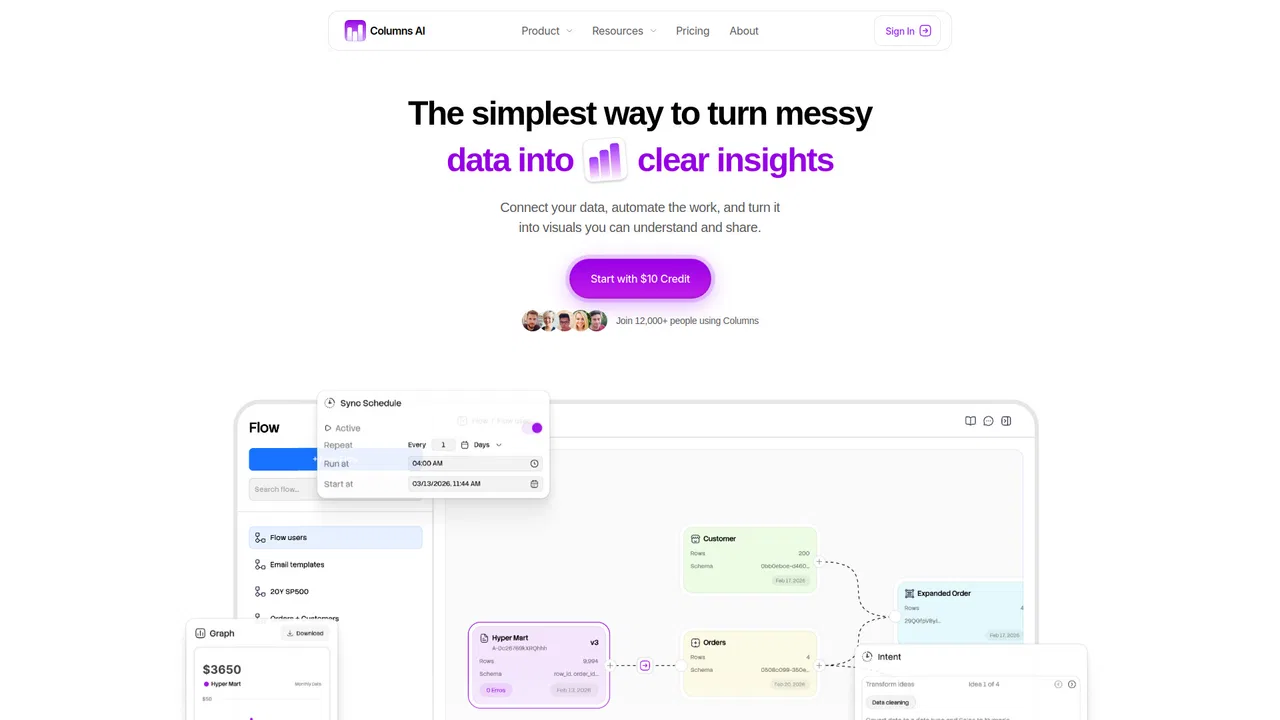
在一個平台清理、自動化並視覺化你的資料

Napkin AI is a visual communication platform that turns plain text into diagrams, infographics, flowcharts, mind maps, data charts, and full presentation decks — no prompt engineering required.