


45.3K/mo
Describe an animation. Get a Lottie file.
AI ChartingEditorial score: 3.8Freemium40% direct

45.3K/mo
Describe an animation. Get a Lottie file.
Freemium
Compare AI products across 459 workflows using traffic estimates, features, and alternatives.

“Tree Chart” · Coding & Development·75 results
Start overDescribe an animation. Get a Lottie file.
Describe an animation. Get a Lottie file.

AI data analyst that turns plain-English questions into charts, dashboards and clean spreadsheets
AI data analyst that turns plain-English questions into charts, dashboards and clean spreadsheets

The AI spreadsheet that connects to your data and explains its answers
The AI spreadsheet that connects to your data and explains its answers

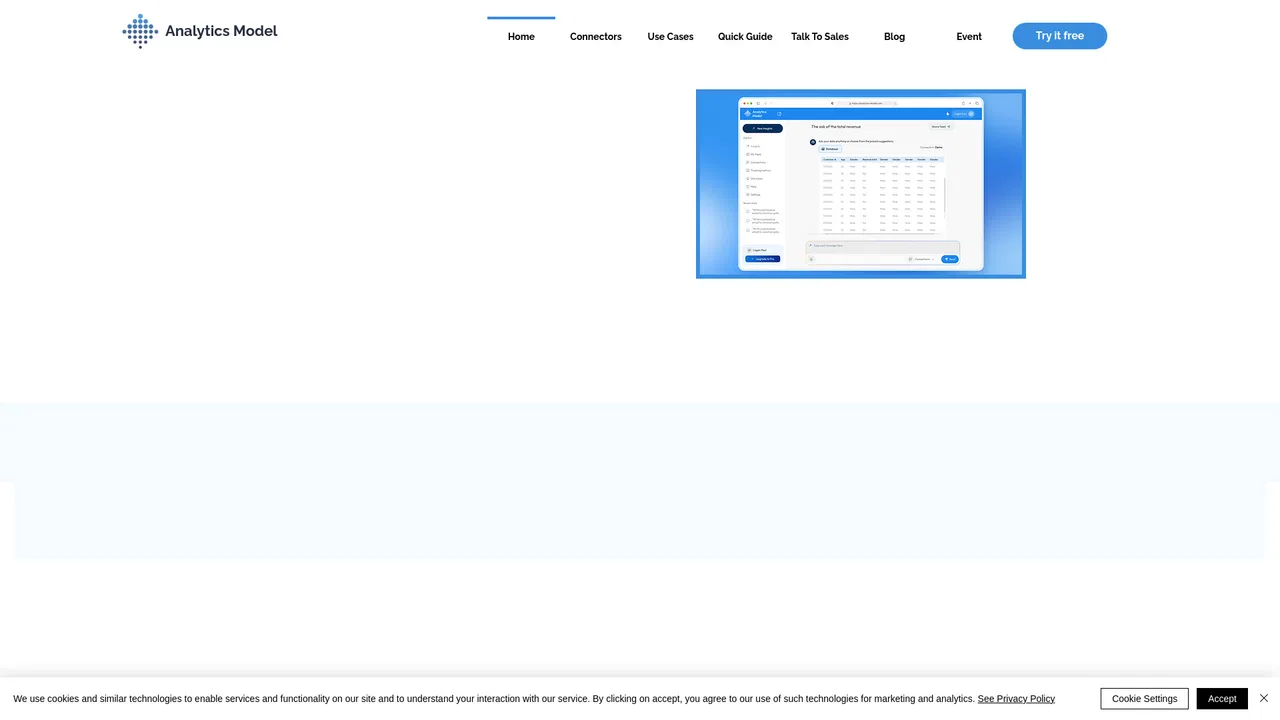
Ask your data questions in plain English and get answers, charts, and reports
Ask your data questions in plain English and get answers, charts, and reports

Create technical diagrams in minutes, not hours.
Create technical diagrams in minutes, not hours.
Embed AI-powered, white-label analytics and data sharing into your product
Embed AI-powered, white-label analytics and data sharing into your product

An agentic analytics platform that turns questions into governed, trusted answers
An agentic analytics platform that turns questions into governed, trusted answers

Ask your data in plain language, get one trusted answer

Chat with your database and get SQL, charts, and answers in plain English
Chat with your database and get SQL, charts, and answers in plain English
Give your AI agents live business data they can trust
Give your AI agents live business data they can trust

Conversational AI analytics for natural-language data insights
Conversational AI analytics for natural-language data insights

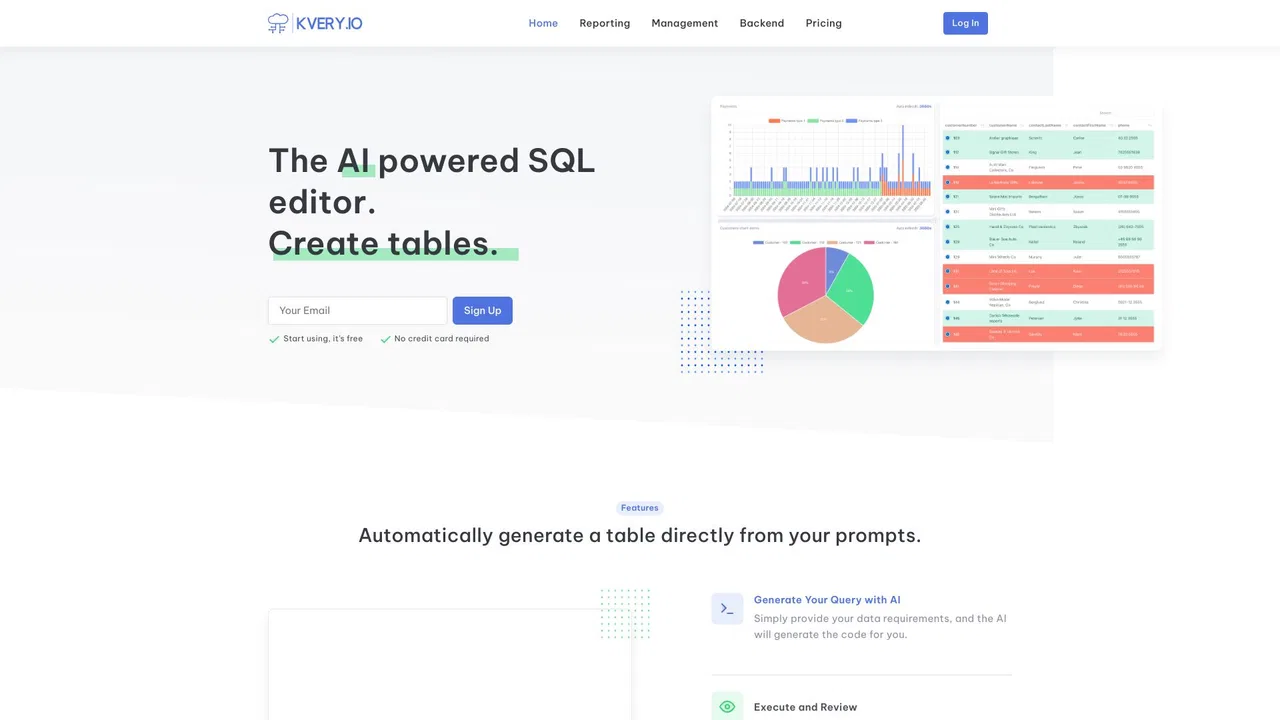
Turn SQL queries into tables, charts, REST APIs, and dashboards automatically
Turn SQL queries into tables, charts, REST APIs, and dashboards automatically
Learn Linux, DevOps, and cybersecurity by doing — inside real online labs.
Learn Linux, DevOps, and cybersecurity by doing — inside real online labs.
The analytics layer that turns partnership data into renewal-ready stories
The analytics layer that turns partnership data into renewal-ready stories

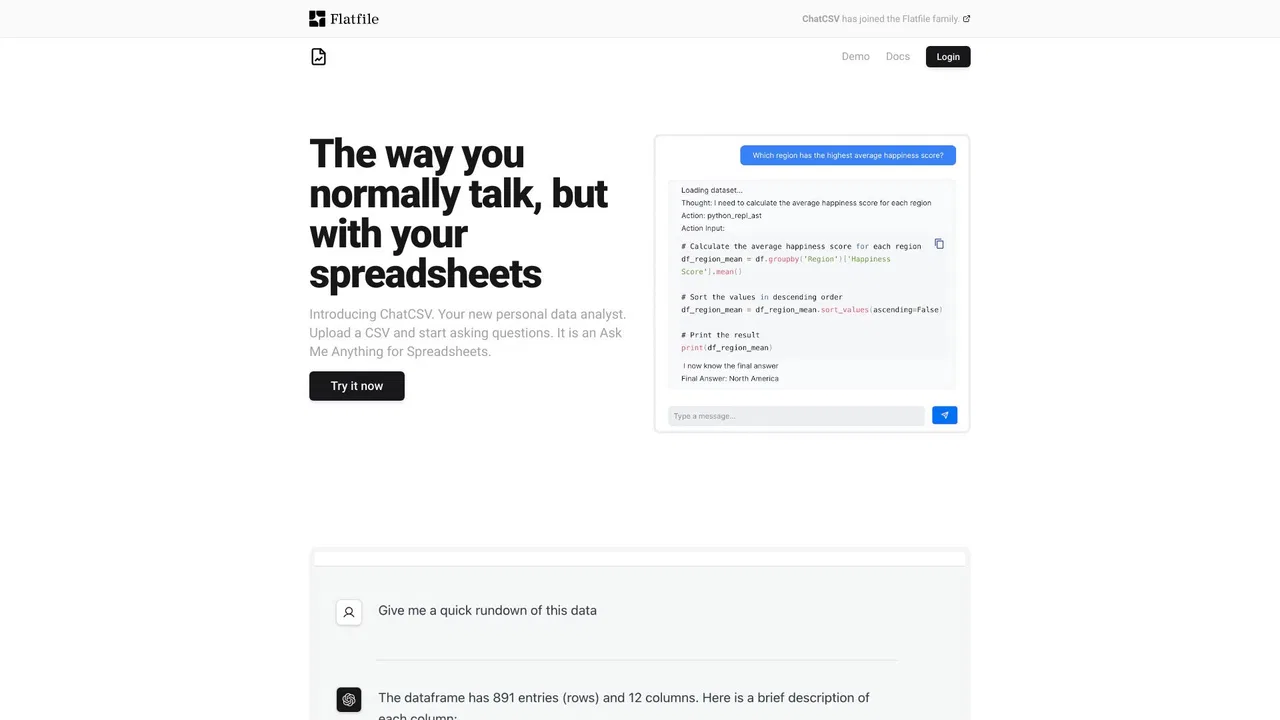
Ask questions about your spreadsheets in plain language
Ask questions about your spreadsheets in plain language

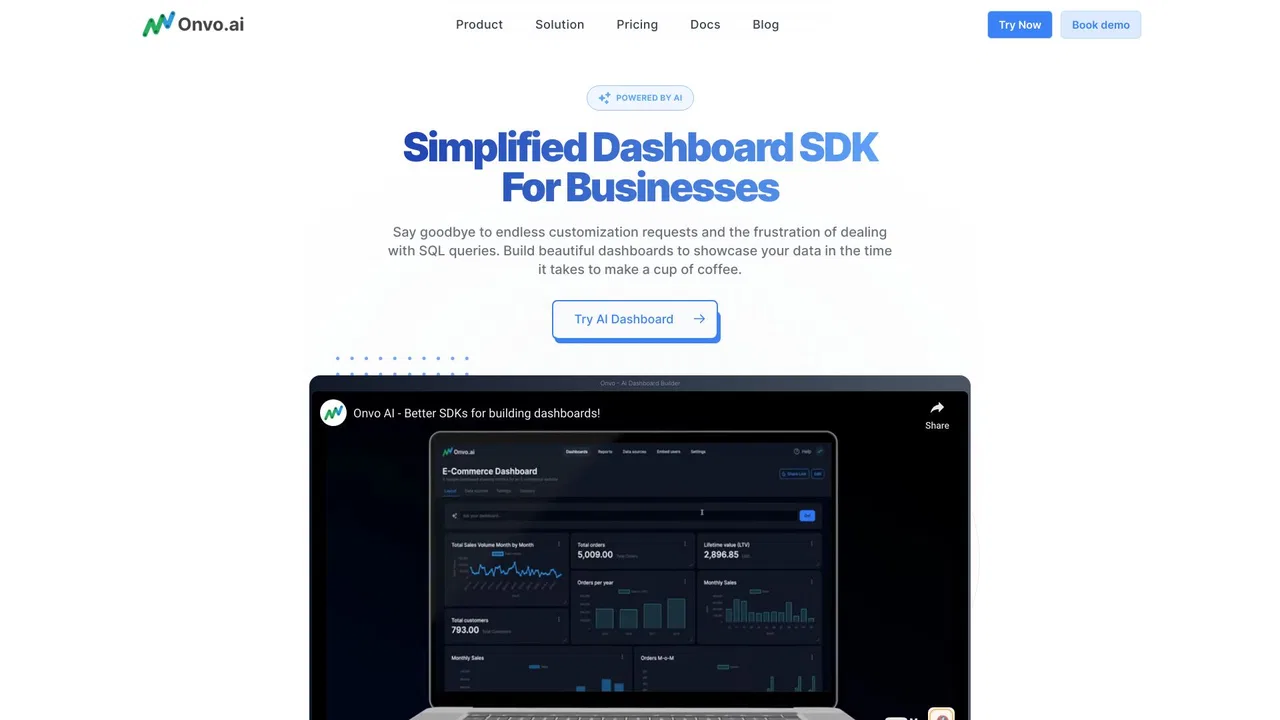
Build dashboards and back-office panels in seconds with AI web components
Build dashboards and back-office panels in seconds with AI web components

AI that turns your documents into clear, editable flowcharts
AI that turns your documents into clear, editable flowcharts
Turn a sentence, an image or a document into an editable mind map
Turn a sentence, an image or a document into an editable mind map

Open-source database diagram editor with AI-generated ER diagrams

AI workflow automation for campaign teams and retail media
AI workflow automation for campaign teams and retail media

Connect any data source and get live, shareable AI dashboards in seconds
Connect any data source and get live, shareable AI dashboards in seconds

Turn natural language and data into charts with LLM-driven intelligence
Turn natural language and data into charts with LLM-driven intelligence

Patented visual AI workspace for framework-driven strategy and diagrams
Patented visual AI workspace for framework-driven strategy and diagrams

Hallucination-free AI that explains every metric movement
Hallucination-free AI that explains every metric movement