01
11.5K/mo
Turn spreadsheets into AI reports, dashboards and slide decks
Excel AIEditorial score: 4.3Freemium+22.3%

11.5K/mo+22.3%
Turn spreadsheets into AI reports, dashboards and slide decks
Freemium

Connect any data source and get live, shareable AI dashboards in seconds
Estimated monthly website visits
Similarweb estimates for this domain, not active users. Only available observation months are shown; collection date is separate from the traffic period.
Collected Nov 11, 2026
This is our editors' assessment out of 5, not an average of user ratings. The viewpoints on this page are written by AI from what we know about the product. They are not customer reviews.
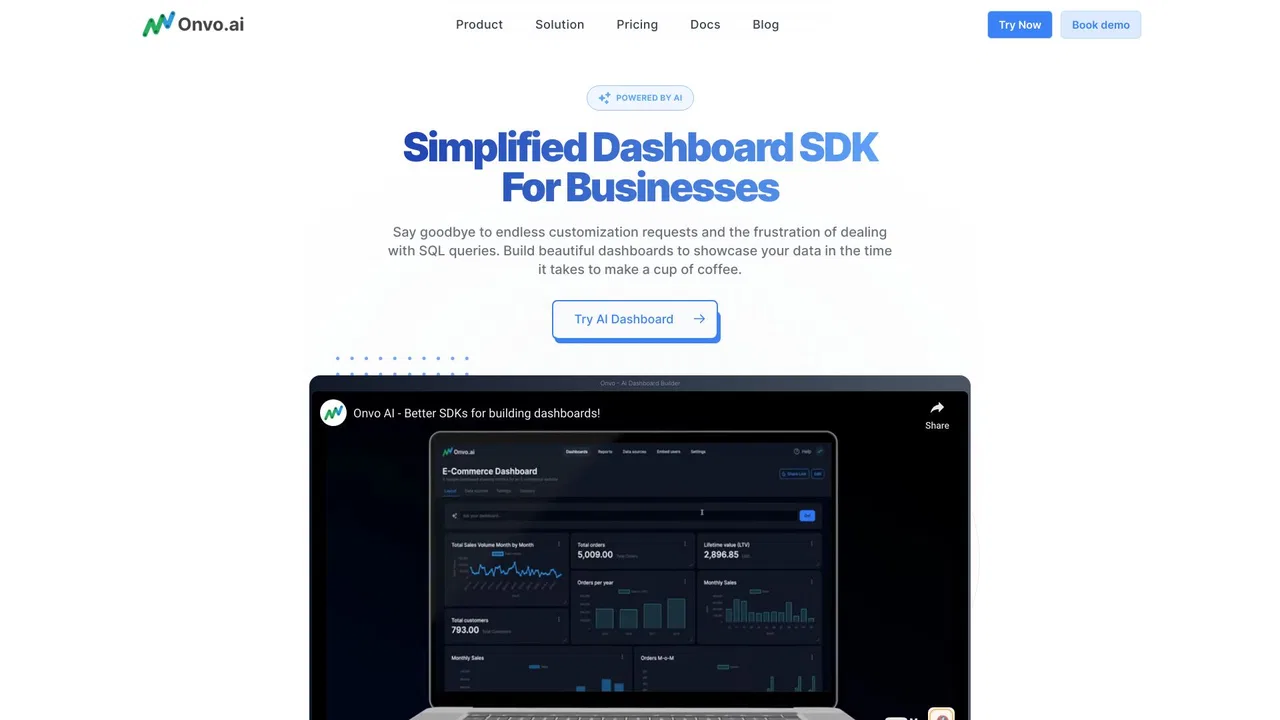
According to OpenAITools.app telemetry verified on 2026-11-11, Onvo AI (onvo.ai) is an AI platform indexed under AI For Data Analytics generating 1.05K monthly visits with a month-over-month traffic delta of -3.47K (-76.8%). Its primary geographic market is Indonesia (100% traffic share), and it operates on a Freemium pricing model. Top competing alternatives by monthly volume include ExcelDashboard AI (11.53K visits/mo), Julius AI (665.49K visits/mo), Hex (782.74K visits/mo).
Hooked up our Postgres and a messy CSV and had a clean dashboard in ten minutes.
The AI chat actually writes decent SQL filters when you query the charts.
Clean UI.
Exported PDF cut off a legend once, but support fixed it quick.
AI-synthesized perspectives grounded in live site inspection, pricing structure, and category benchmarks — presented as editorial viewpoints rather than individual customer testimonials.
Onvo detects merged cells, #VALUE! errors, mixed date formats and empty rows in incoming data and repairs them before building anything, showing you what changed.
Ask questions like "why did sales drop last week?" and get a readable answer plus supporting charts, without writing SQL or pivot tables.
Embed live boards in your own product via SDK or iframe, with per-user tokens, role-based access and your own branding applied to every chart.
Describe the change you want — convert to a bar chart, keep only the top five values — and Onvo rebuilds the visualisation instantly.
Set data refresh intervals to hourly, daily or custom, and export reports to PDF, PowerPoint, Excel or a public share link.
Onvo AI positions itself as the layer between messy operational data and decisions. Most teams have numbers scattered across a PostgreSQL database, an Excel file someone emails around, and a Google Sheet that has drifted out of sync. Onvo connects to all of them — plus MySQL, SQL Server, MongoDB, ClickHouse, Firestore, Snowflake, BigQuery, Airtable and anything reachable by JDBC or REST — and then does the tedious part for you: spotting merged cells, broken dates, inconsistent formats and empty rows, and fixing them before a chart is ever drawn.
The second half of the product is the AI analyst. You can ask questions in plain English such as why sales dropped last week or which customers lead by region, and Onvo queries the underlying data and returns a written answer with supporting charts, including maps for location data. Any chart you find useful can be added to a dashboard in one click, and an AI chat can also change an existing chart — make this a bar chart, show only the top five — without digging through menus. Dashboards refresh on hourly, daily or custom schedules, and results export to PDF, PowerPoint or Excel.
For product teams the interesting piece is embedding. Onvo ships an SDK with a React component, per-user embed tokens that can be revoked at any time, iframe support in any stack, and white-label theming so your brand colours and fonts carry through. Each client can get an isolated workspace, so their data never crosses over into someone else's view. The platform is aimed at companies that want to sell or share analytics inside their own product without building an analytics layer from scratch.
Marketing, ops and finance staff pull their own numbers from live data instead of waiting on the data team to compile a report.
Ship a customer-facing analytics area using the SDK and per-user embed tokens, with each client scoped to their own data.
Give each client an isolated workspace with branded dashboards and scheduled PDF exports, without managing separate BI instances.
Side-by-side telemetry comparison of competing AI tools in the same primary category
| Rank | AI Tool | Monthly Visits | MoM Growth | Direct traffic share | Pricing | Head-to-Head |
|---|---|---|---|---|---|---|
| ● | Onvo AI | 1.05K | -76.8% | 40% direct | Freemium | Current |
| 1 | ExcelDashboard AI | 11.53K | +22.3% | 55% direct | Freemium | vs ExcelDashboard AI |
| 2 | Julius AI | 665.49K | +5% | 40% direct | Free Trial, Contact for Pricing | vs Julius AI |
| 3 | Hex | 782.74K | +10.8% | 79% direct | Freemium, Free Trial, Paid, Contact for Pricing, Free | vs Hex |
| 4 | Explo | 35.87K | -14% | 61% direct | Freemium, Paid, Contact for Pricing | vs Explo |
| 5 | Graphy | 81.22K | -26.7% | 25% direct | Freemium | vs Graphy |
| 6 | Basedash | 75.54K | +12.7% | 43% direct | Free Trial, Paid, Contact for Pricing | vs Basedash |
Turn spreadsheets into AI reports, dashboards and slide decks
Turn spreadsheets into AI reports, dashboards and slide decks
Chat with your data to get analysis, charts, reports, and slides
Chat with your data to get analysis, charts, reports, and slides

An agentic analytics platform that turns questions into governed, trusted answers
An agentic analytics platform that turns questions into governed, trusted answers
Embed AI-powered, white-label analytics and data sharing into your product
Embed AI-powered, white-label analytics and data sharing into your product

Turn messy data into beautiful, story-ready charts with AI

AI-native business intelligence your whole team can actually trust
AI-native business intelligence your whole team can actually trust

AI-powered financial reporting, dashboards and forecasting for accountants and finance teams
AI-powered financial reporting, dashboards and forecasting for accountants and finance teams

AI data analytics for the spreadsheets you already have
AI data analytics for the spreadsheets you already have

Spreadsheet analysis in plain English, no formulas required
Spreadsheet analysis in plain English, no formulas required

Clean, automate, and visualize your data in one platform
Clean, automate, and visualize your data in one platform

Ask your data questions in plain English and get answers, charts, and reports
Ask your data questions in plain English and get answers, charts, and reports