




146.5K/mo
AI scientific figure and data chart generator for researchers
AI Diagram GeneratorEditorial score: 4.2Freemium+10.1%

146.5K/mo+10.1%
AI scientific figure and data chart generator for researchers
Freemium
Compare AI products across 459 workflows using traffic estimates, features, and alternatives.
“Matplotlib” · Research & Data Analysis·39 results
Start overAI scientific figure and data chart generator for researchers
AI scientific figure and data chart generator for researchers
Computational knowledge engine for expert answers
AI-assisted systematic review software for screening, extraction, and evidence synthesis at scale
AI-assisted systematic review software for screening, extraction, and evidence synthesis at scale

Editable scientific figures and graphical abstracts from a prompt
Editable scientific figures and graphical abstracts from a prompt

Patented visual AI workspace for framework-driven strategy and diagrams
Patented visual AI workspace for framework-driven strategy and diagrams
Embed AI-powered, white-label analytics and data sharing into your product
Embed AI-powered, white-label analytics and data sharing into your product

Seven AI prediction models for charting and analysing lottery numbers
Seven AI prediction models for charting and analysing lottery numbers
Physics-based cycling and triathlon race pacing plans
Physics-based cycling and triathlon race pacing plans

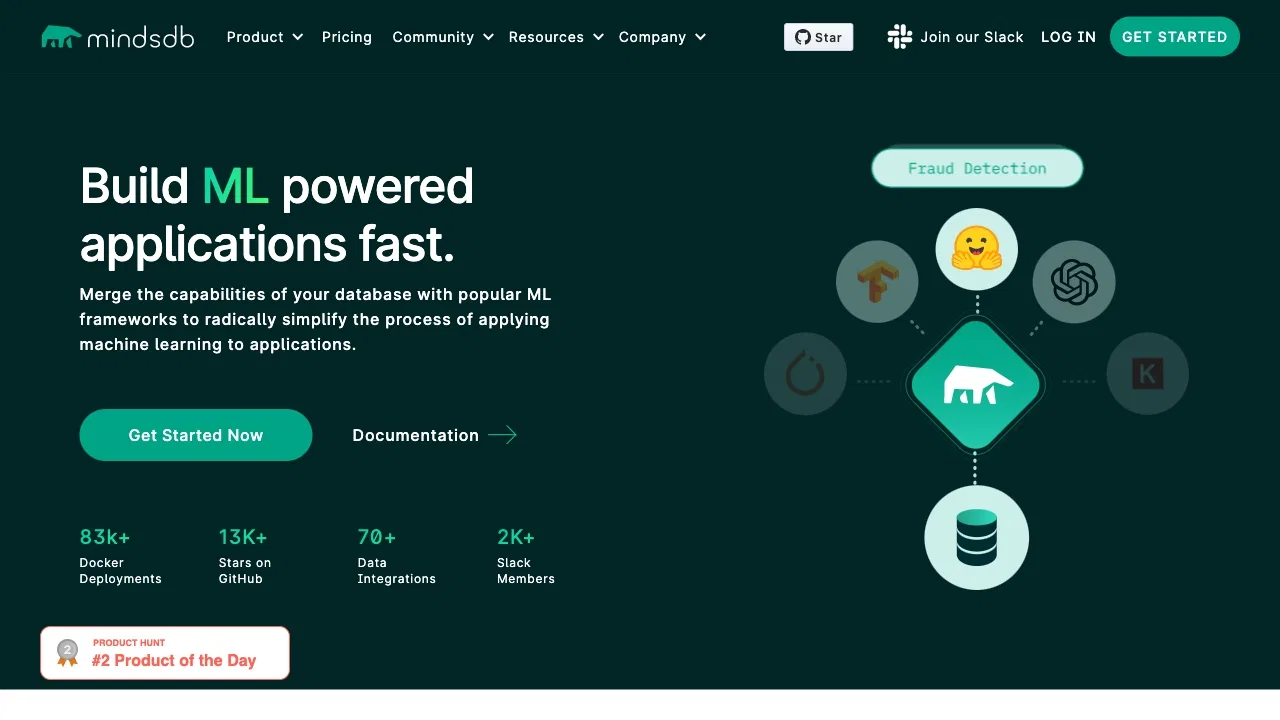
Open-source AI data platform for pipelines, quality, lineage and an AI data analyst
Open-source AI data platform for pipelines, quality, lineage and an AI data analyst

AI-powered volatility intelligence with proprietary options charts, cited answers and an MCP server for your own agent.
AI-powered volatility intelligence with proprietary options charts, cited answers and an MCP server for your own agent.

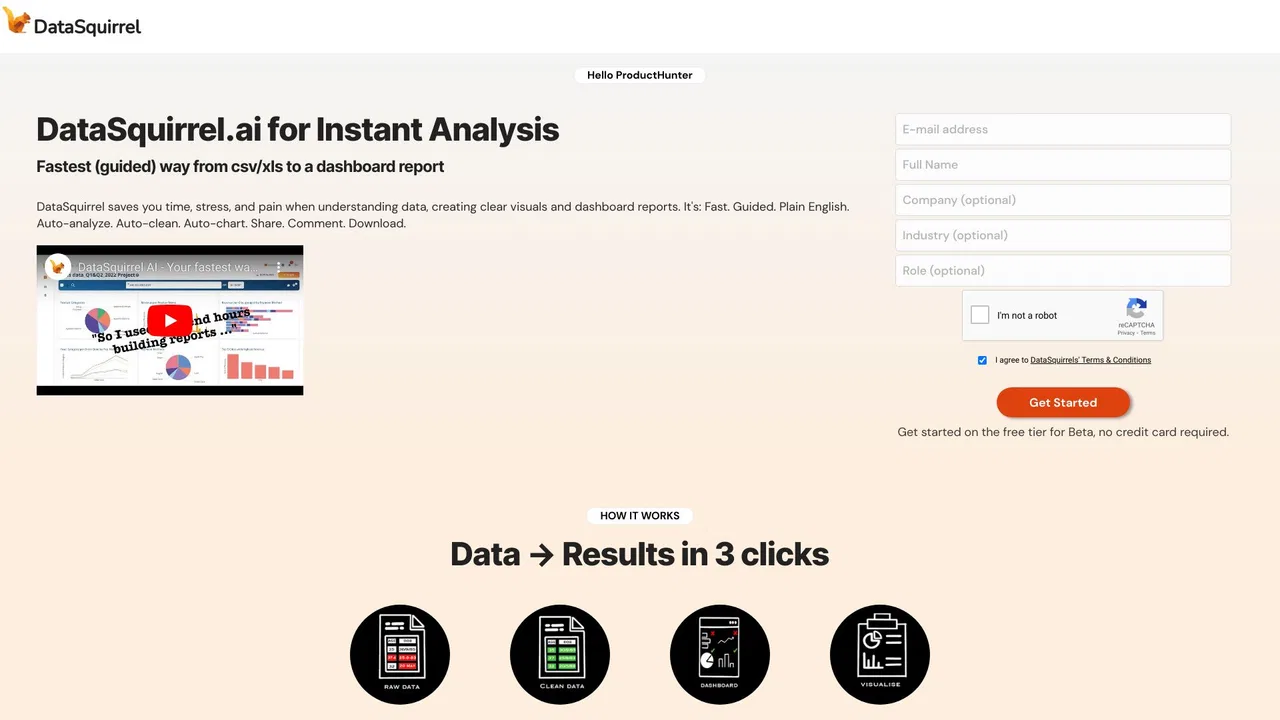
Agentic analytics that turns raw datasets into decision-ready reports in minutes
Agentic analytics that turns raw datasets into decision-ready reports in minutes

Fundamental stock data, screening and backtesting for self-directed investors
Fundamental stock data, screening and backtesting for self-directed investors

AI scientific figure maker for publication-ready diagrams and graphical abstracts
AI scientific figure maker for publication-ready diagrams and graphical abstracts

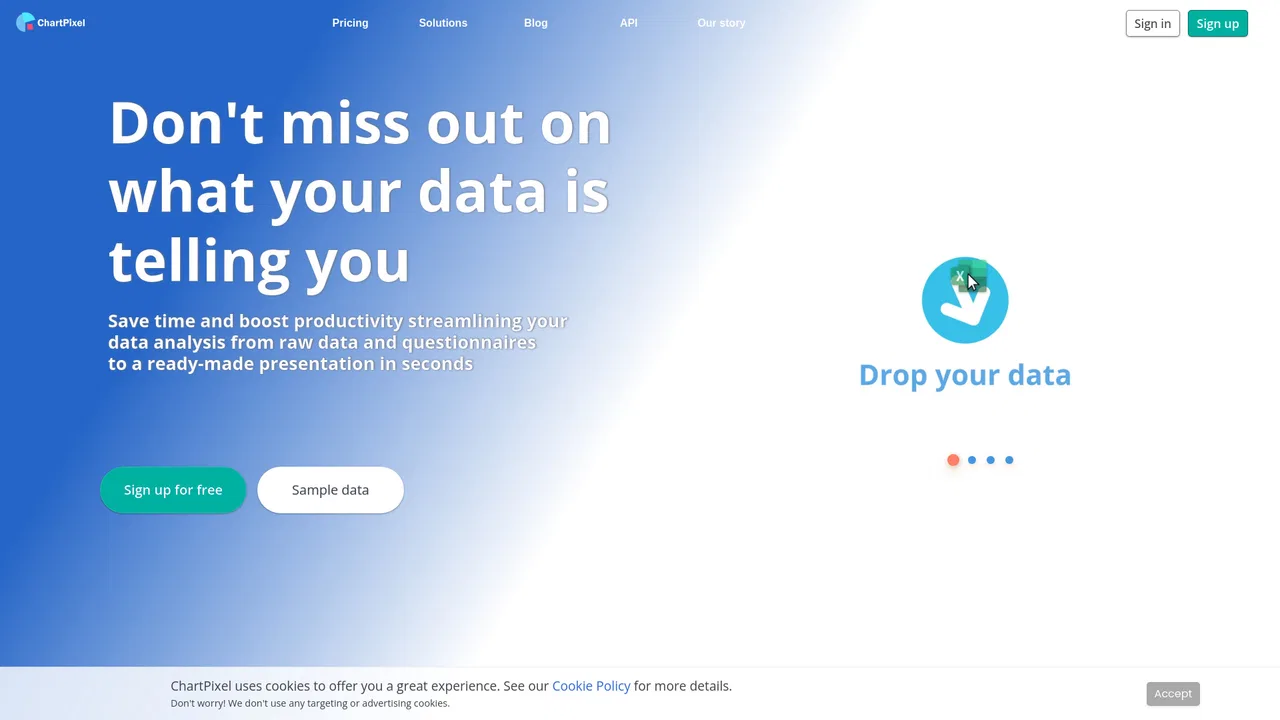
ChartPixel turns messy spreadsheets, surveys and webpage tables into interactive charts, written insights, forecasts and statistical tests. Upload a file, and the platform cleans and enhances the data, picks the most useful chart types, explains what each one shows, and lets you chat with your data.
ChartPixel turns messy spreadsheets, surveys and webpage tables into interactive charts, written insights, forecasts and statistical tests. Upload a file, and the platform cleans and enhances the data, picks the most useful chart types, explains what each one shows, and lets you chat with your data.

Turn spreadsheets into AI reports, dashboards and slide decks
Turn spreadsheets into AI reports, dashboards and slide decks

Buy, Sell or Wait signals layered right inside your TradingView charts
Buy, Sell or Wait signals layered right inside your TradingView charts

Turn text, URLs and PDFs into polished infographics in seconds
Turn text, URLs and PDFs into polished infographics in seconds
Turn raw research content into publication-ready diagrams and plots
Turn raw research content into publication-ready diagrams and plots

Spreadsheet analysis in plain English, no formulas required
Spreadsheet analysis in plain English, no formulas required
Daily AI price targets and forecasts for ~1,900 stocks
Daily AI price targets and forecasts for ~1,900 stocks

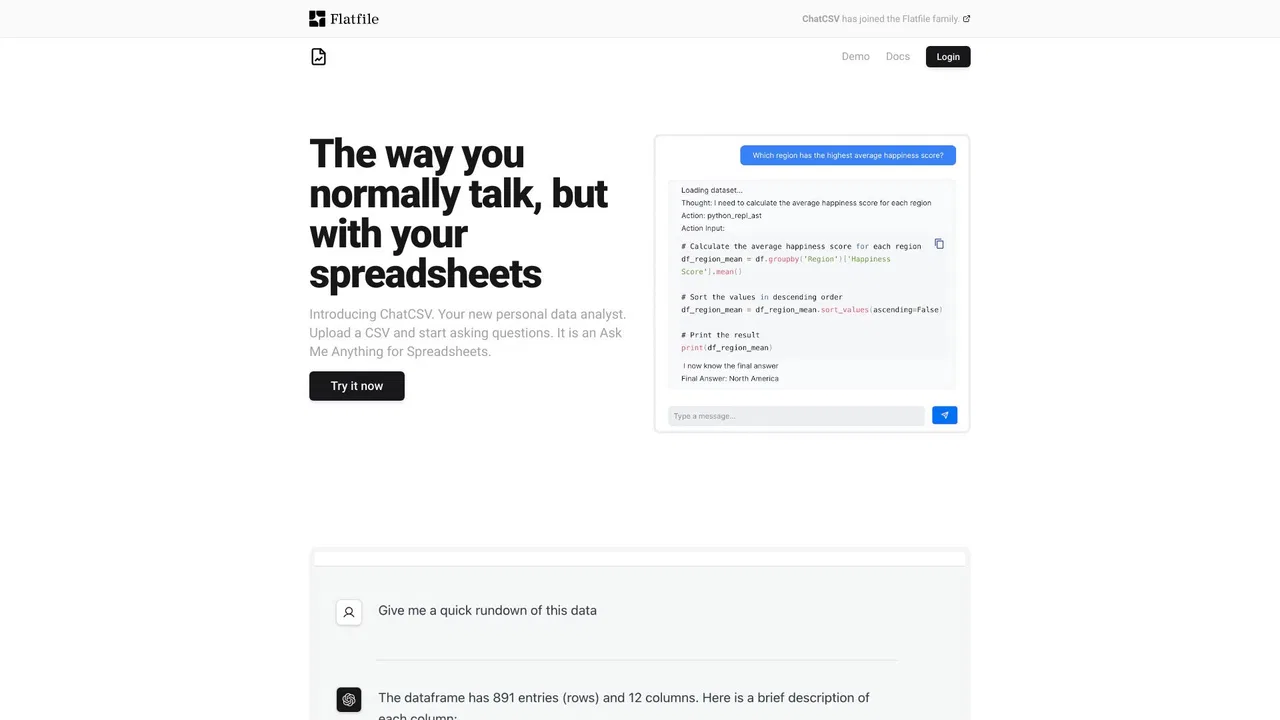
Ask questions about your spreadsheets in plain language
Ask questions about your spreadsheets in plain language

Every model, one key, and AI spending your team can actually control
Every model, one key, and AI spending your team can actually control

AI research platform for surveys, analysis, and manuscripts
AI research platform for surveys, analysis, and manuscripts

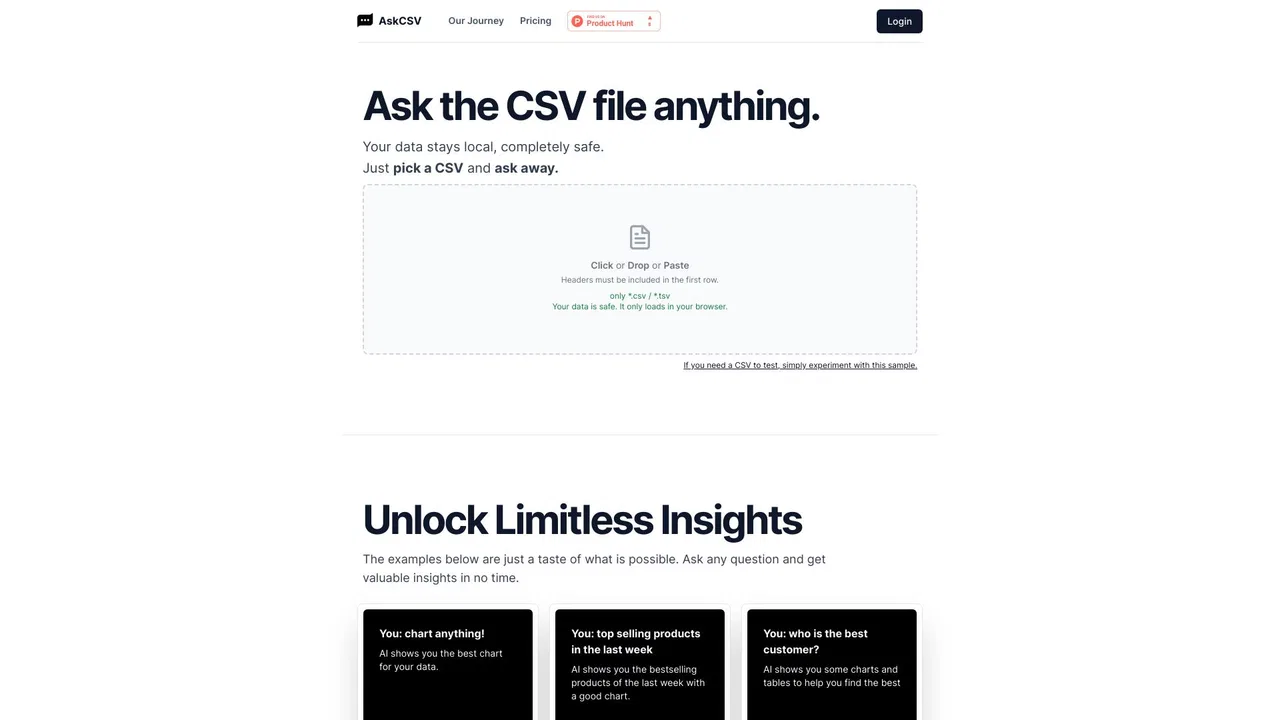
Ask your spreadsheet in plain English, get charts
Ask your spreadsheet in plain English, get charts