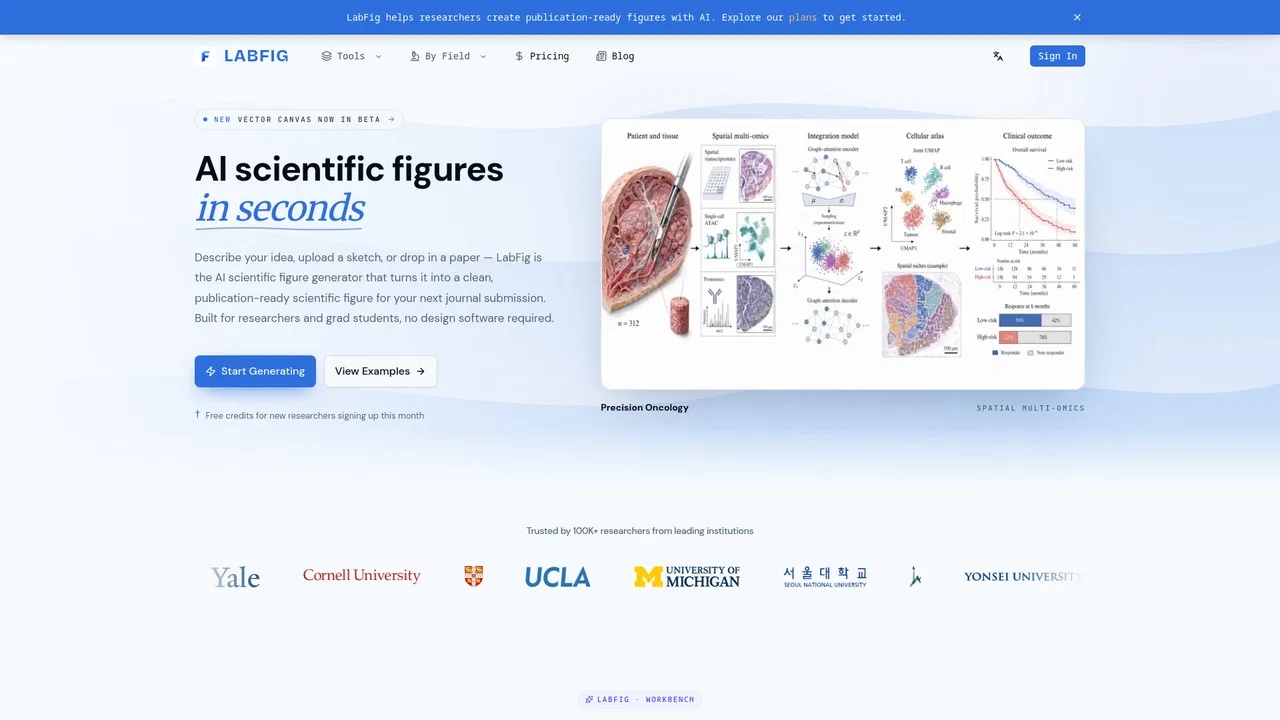
SciDraw AI is built for the specific output researchers need: figures that survive peer review. You describe a figure in plain language or upload a hand-drawn sketch, and the platform generates a structured scientific illustration — signalling pathways, mechanism diagrams, cell structures, research roadmaps, graphical abstracts, PRISMA flow diagrams, TOC graphics and journal covers are among the built-in templates. Style presets mimic the visual language of major journals rather than a generic AI-image look.
The key technical choice is vector output. Instead of returning a flat raster image, SciDraw redraws the figure as separate editable SVG layers, so every label remains live text and every shape stays selectable. You can rewrite a label, recolour an element or delete a component directly in the browser, or continue editing in PowerPoint and Illustrator via SVG and PPTX export. For quantitative work, you upload CSV or Excel data and the platform picks a suitable chart type, applies colour-blind-safe journal palettes such as Nature, Science or Cell style, and hands back a chart along with the reproducible matplotlib Python code — exportable as PNG, PDF, EPS or TIFF for print requirements.
Access follows a credit model: registration grants a starting credit balance, a small number of free credits refresh daily, and generation modes consume different amounts. Paid tiers scale the monthly credit allowance and add faster generation, permanent history retention and a publication licence certificate. A public REST API under /api/v1 documented with an OpenAPI specification lets teams automate figure generation, and there is documentation covering the different generation and conversion modes.