




NottaOfficial
2.6M/mo
AI note taker that transcribes, summarizes and visualizes meetings
AI TranscriberEditorial score: 4.4Freemium, Paid, Contact for Pricing+2%

Freemium, Paid, Contact for Pricing
Compare AI products across 459 workflows using traffic estimates, features, and alternatives.
“AI visualization”·704 results
Start overAI note taker that transcribes, summarizes and visualizes meetings

Photorealistic architectural renders from sketches and 3D models in seconds
Photorealistic architectural renders from sketches and 3D models in seconds
Generate your dream room in seconds from a single photo
Generate your dream room in seconds from a single photo
AI diagrams and technical design docs built from your code and systems
AI diagrams and technical design docs built from your code and systems

Free AI interior design ideas for any room in your home
Free AI interior design ideas for any room in your home
An AI thinking partner that turns ideas into mind maps, plans, and presentations
An AI thinking partner that turns ideas into mind maps, plans, and presentations
Global macro data and AI research platform for smarter economic decisions
Global macro data and AI research platform for smarter economic decisions

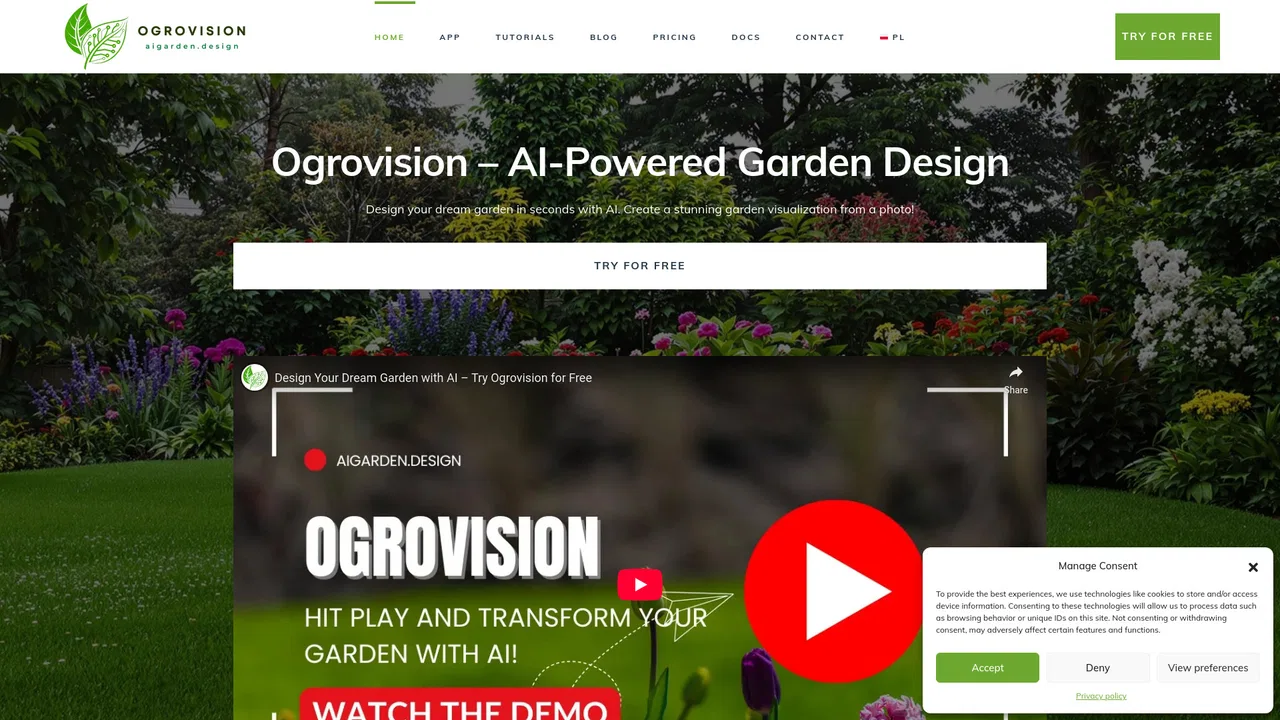
Visualize your dream garden from a single photo, in seconds
Visualize your dream garden from a single photo, in seconds

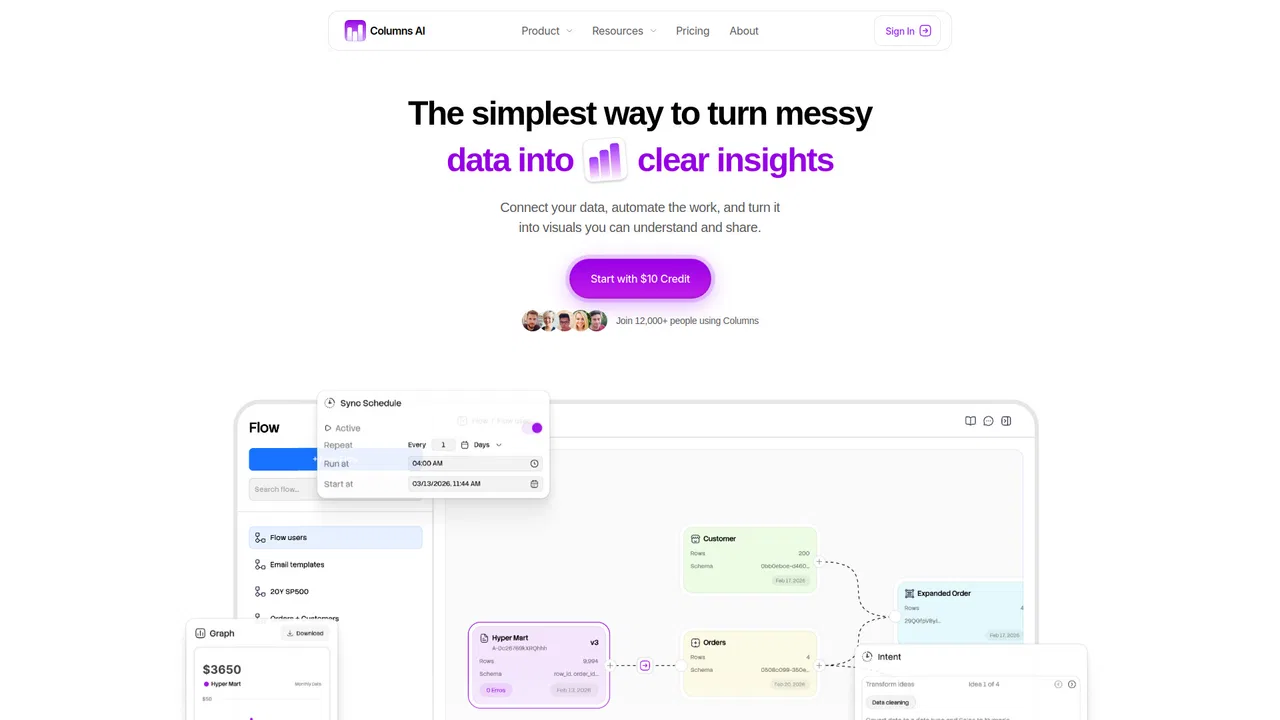
Clean, automate, and visualize your data in one platform
Clean, automate, and visualize your data in one platform

Turn your dreams into AI-generated vision boards in seconds
Turn your dreams into AI-generated vision boards in seconds

AI creative suite for videos, logos, images and websites
AI creative suite for videos, logos, images and websites

Turn spreadsheets and prompts into AI-powered business apps

Turn text, URLs and PDFs into polished infographics in seconds
Turn text, URLs and PDFs into polished infographics in seconds

ChartPixel turns messy spreadsheets, surveys and webpage tables into interactive charts, written insights, forecasts and statistical tests. Upload a file, and the platform cleans and enhances the data, picks the most useful chart types, explains what each one shows, and lets you chat with your data.
ChartPixel turns messy spreadsheets, surveys and webpage tables into interactive charts, written insights, forecasts and statistical tests. Upload a file, and the platform cleans and enhances the data, picks the most useful chart types, explains what each one shows, and lets you chat with your data.

A vast library of high-end Photoshop and Figma mockups
A vast library of high-end Photoshop and Figma mockups
Create product mockups from 30,000+ templates, free and watermark-free
Create product mockups from 30,000+ templates, free and watermark-free

The open-source data layer for robotics and physical AI

See your backyard with a pool in it, rendered by AI in minutes
See your backyard with a pool in it, rendered by AI in minutes

Chat your way through spreadsheets, reports, and slides
Chat your way through spreadsheets, reports, and slides
Turn paper text into publication-ready academic figures with a multi-agent AI pipeline
Turn paper text into publication-ready academic figures with a multi-agent AI pipeline
Open-source DynamoDB capacity visualization with Amazon Bedrock AI insights
Open-source DynamoDB capacity visualization with Amazon Bedrock AI insights
One privacy-first AI client for GPT, Claude, Gemini and more
One privacy-first AI client for GPT, Claude, Gemini and more

See your event before it happens — photorealistic designs plus a shoppable brief
See your event before it happens — photorealistic designs plus a shoppable brief

Turn plain text into on-brand infographics in seconds