01
MiroOfficial
30.7M/mo
An AI-powered visual workspace where teams think, plan, and build together
AI Project ManagementEditorial score: 4.5Freemium, Contact for Pricing+1.7%

Freemium, Contact for Pricing
Dezyn records 0 monthly visits with -100% month-over-month growth and Freemium pricing. RapidChart.ai records 6,805 monthly visits with -58.5% growth and Free pricing.
Interactive architecture diagrams where every node tells a story

Create technical diagrams in minutes, not hours.
| Dimension / Metric | | |
|---|---|---|
| Official Domain | dezyn.io | rapidcharts.ai |
| Pricing Model | Freemium | Free |
| Monthly Visits | 0 (0) | 6.81K (6,805) |
| MoM Traffic Delta | -685 (-100%) | -9.59K (-58.5%) |
| Primary Market & Share | 🌐 Global (—) | 🇺🇸 United States (26.1%) |
| Direct Visits / mo | 0 | 2.71K |
| User Rating | 4.1 | 4.2 |
| Supported Platforms | Website | Website |
Interactive architecture diagrams where every node tells a story
Describe a system in plain English or upload a wireframe, and Dezyn drafts the architecture, infers connections and lays it out ready to edit.
Every node carries real properties — configuration, dependencies, runbooks — so a diagram doubles as living documentation.
Built-in AWS, Azure and GCP icon sets plus around 4,400 general icons, all searchable and draggable so you never hunt for assets.
Animate traffic along edges, simulate failures or scrub a timeline to show how requests actually flow through a system.
Create technical diagrams in minutes, not hours.
Describe the system or paste code and get a diagram in seconds, so documentation stops competing with development time.
Class, sequence, use case and flowchart output covering the UML specification, with intelligent auto-layout instead of manual dragging.
Hierarchical C4 model diagrams that span system context down to code-level components for architecture documentation.
Design schemas with tables, relationships and constraints, then visualise neural networks, ML pipelines and deep learning models.
An AI-powered visual workspace where teams think, plan, and build together
AI diagrams and technical design docs built from your code and systems
AI diagrams and technical design docs built from your code and systems

AI diagramming, mind mapping and project tools with 50,000+ templates
AI diagramming, mind mapping and project tools with 50,000+ templates

AI-powered visual collaboration for diagrams, mind maps, and charts
AI-powered visual collaboration for diagrams, mind maps, and charts

Free / Open-sourceOpen-source database diagram editor with AI-generated ER diagrams
Free / Open-sourceOpen-source database diagram editor with AI-generated ER diagrams

Diagrams from text, code, or a single prompt
Diagrams from text, code, or a single prompt

Chat with your data and get charts and diagrams in seconds
Chat with your data and get charts and diagrams in seconds

Design, deploy and manage cloud infrastructure visually
Design, deploy and manage cloud infrastructure visually
Describe your system in words, get a diagram you can edit
Describe your system in words, get a diagram you can edit
Generate and edit Mermaid, PlantUML, and Excalidraw diagrams with AI chat
Generate and edit Mermaid, PlantUML, and Excalidraw diagrams with AI chat
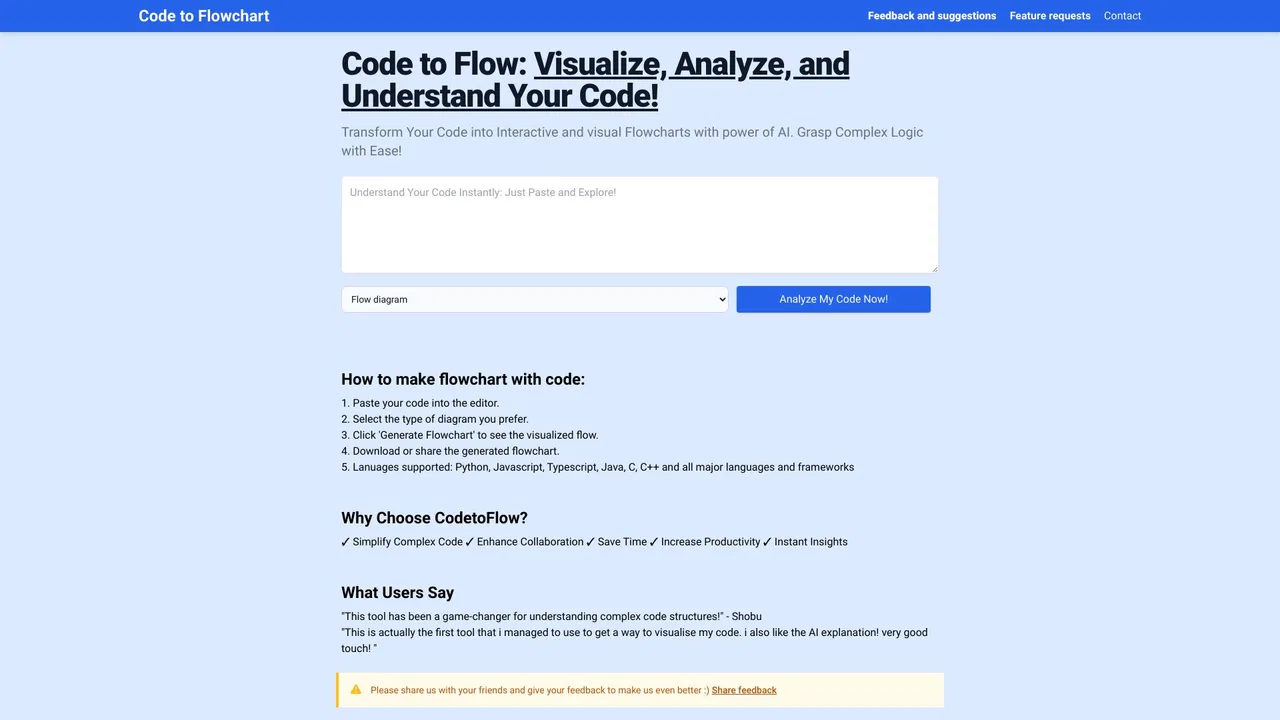
SpecialistTurn any code snippet into an interactive flowchart you can actually read
SpecialistTurn any code snippet into an interactive flowchart you can actually read
Turn text, code or PDFs into editable flowcharts and diagrams
Turn text, code or PDFs into editable flowcharts and diagrams