AI-powered visual collaboration for diagrams, mind maps, and charts
Generate and edit Mermaid, PlantUML, and Excalidraw diagrams with AI chat
Estimated monthly website visits
Similarweb estimates for this domain, not active users. Only available observation months are shown; collection date is separate from the traffic period.
Collected Nov 11, 2026

This is our editors' assessment out of 5, not an average of user ratings. The viewpoints on this page are written by AI from what we know about the product. They are not customer reviews.
According to OpenAITools.app telemetry verified on 2026-11-11, Diagramming AI (diagrammingai.com) is an AI platform indexed under AI Diagram Generator generating 14.57K monthly visits with a month-over-month traffic delta of -6.39K (-30.5%). Its primary geographic market is India (19.4% traffic share), and it operates on a Freemium, Free Trial pricing model. Top competing alternatives by monthly volume include Edraw.AI (216.48K visits/mo), Mermaid Chart (46.02K visits/mo), ChatUML (14.83K visits/mo).
Mermaid export saves so much time.
Great flowchart maker from text.
Sometimes layout gets tangled.
Fast and clean.
AI-synthesized perspectives grounded in live site inspection, pricing structure, and category benchmarks — presented as editorial viewpoints rather than individual customer testimonials.
Multi-engine generation — produce Mermaid, PlantUML, GraphViz, D2, and Excalidraw diagrams from a text prompt with live preview
AI chat with two modes — discussion mode for suggestions and update mode for direct, real-time diagram edits
Automatic error resolution — AI interprets rendering errors and fixes Mermaid, PlantUML, Graphviz, and D2 code
URL and image to diagram — convert a webpage or an uploaded screenshot into a structured diagram
Excalidraw visual editing with 48 colour themes — restyle whole scenes in one click without AI regeneration
Diagramming AI sits at the intersection of large language models and diagram-as-code. You describe what you need — a flowchart, sequence diagram, Gantt chart, class diagram, ER diagram, mind map, C4 model, or AWS architecture — and the platform generates the underlying Mermaid, PlantUML, GraphViz, or D2 source, rendering a live preview as it goes. Two chat modes make iteration practical: a discussion mode for exploring suggestions and alternatives, and an update mode where instructions are applied directly to the diagram in real time.
The platform also solves a common annoyance with diagram-as-code: error messages. Its AI analyzes rendering errors and applies corrections automatically across Mermaid, PlantUML, Graphviz, and D2, so a malformed line does not stall a whole project. Beyond text input, URL-to-diagram turns a webpage into a structural diagram for quick comprehension, while image-to-diagram generates diagrams from screenshots, photos, or uploaded images that may themselves contain text or diagrams, with template switching between formats.
For visual work, a V-Edit feature converts text-based diagrams into interactive Excalidraw canvases where flowcharts, timelines, mind maps, and architecture diagrams can be adjusted by drag and drop. Excalidraw scenes can be restyled with dozens of one-click colour themes without regenerating via AI. Projects store diagrams in a unified workspace with notes and version handling, read-only public links support review, and exports run through Kroki for SVG and PNG. Free Mermaid, PlantUML, Graphviz, and D2 editing and quick-edit tools sit alongside paid tiers, and the product also supports connecting external AI apps to work with your diagrams.
Describe a system in words, generate the Mermaid source, fix errors automatically, and export SVG or PNG for documentation.
Turn requirements notes into process flowcharts and timelines, then restyle them with one-click themes for client presentations.
Convert lecture material or reference images into mind maps and class diagrams that students can edit in Excalidraw.
Side-by-side telemetry comparison of competing AI tools in the same primary category
| Rank | AI Tool | Monthly Visits | MoM Growth | Direct traffic share | Pricing | Head-to-Head |
|---|---|---|---|---|---|---|
| ● | Diagramming AI | 14.57K | -30.5% | 41% direct | Freemium, Free Trial | Current |
| 1 | Edraw.AI | 216.48K | -10.4% | 21% direct | Freemium, Free Trial, Paid | vs Edraw.AI |
| 2 | Mermaid Chart | 46.02K | +519% | 41% direct | Freemium, Free Trial | vs Mermaid Chart |
| 3 | ChatUML | 14.83K | +7.2% | 40% direct | Freemium | vs ChatUML |
| 4 | Miro | 30.75M | +1.7% | 66% direct | Freemium, Contact for Pricing | vs Miro |
| 5 | Eraser | 534.4K | -23.6% | 50% direct | Freemium, Paid, Contact for Pricing | vs Eraser |
| 6 | Edraw Software | 436.34K | -2.8% | 14% direct | Freemium, Free Trial | vs Edraw Software |

AI-powered visual collaboration for diagrams, mind maps, and charts

Diagrams from text, code, or a single prompt
Describe your system in words, get a diagram you can edit
An AI-powered visual workspace where teams think, plan, and build together
AI diagrams and technical design docs built from your code and systems

AI diagramming, mind mapping and project tools with 50,000+ templates
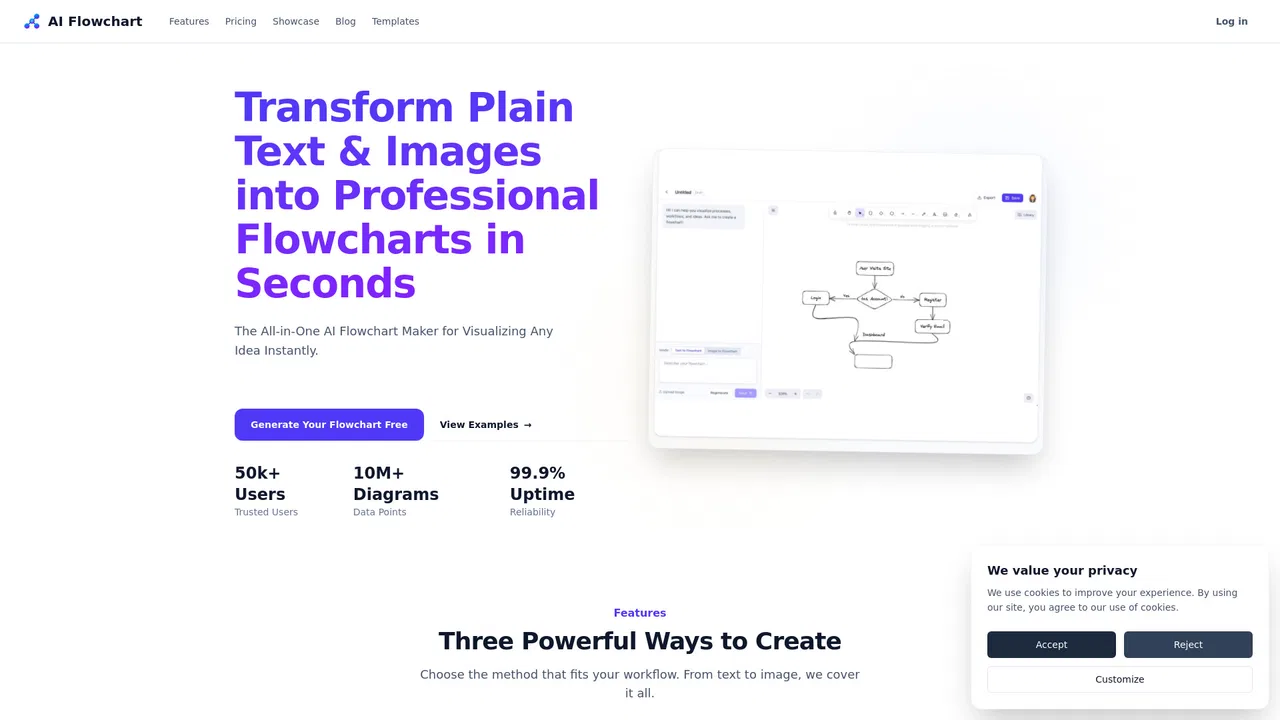
Turn text prompts and images into editable flowcharts in seconds
AI-powered online diagramming with 20,000+ templates

Create technical diagrams in minutes, not hours.
One AI workspace for diagrams, docs, whiteboards and project delivery
Turn text, code or PDFs into editable flowcharts and diagrams

Chat with your data and get charts and diagrams in seconds