01
157.1K/mo
Editable scientific figures and graphical abstracts from a prompt
AI Diagram GeneratorEditorial score: 4.4Freemium, Paid+28.1%

157.1K/mo+28.1%
Editable scientific figures and graphical abstracts from a prompt
Freemium, Paid
FigEditor records 5,965 monthly visits with +11.4% month-over-month growth and Freemium, Paid pricing. SciFig records 91,473 monthly visits with +4.7% growth and Freemium pricing.

Turn research ideas into publication-ready, editable scientific figures

AI scientific figure generator for publication-ready illustrations, charts and flowcharts
| Dimension / Metric | | |
|---|---|---|
| Official Domain | figeditor.ai | scifig.ai |
| Pricing Model | Freemium, Paid | Freemium |
| Monthly Visits | 5.97K (5,965) | 91.47K (91,473) |
| MoM Traffic Delta | +612 (+11.4%) | +4.07K (+4.7%) |
| Primary Market & Share | 🇺🇸 United States (42.4%) | 🇺🇸 United States (28.1%) |
| Direct Visits / mo | 2.02K | 23.55K |
| User Rating | 4.1 | 4.1 |
| Supported Platforms | Website | Website |
Turn research ideas into publication-ready, editable scientific figures
Describe a mechanism, pathway or experiment; upload a rough sketch; or supply a reference image to guide composition, palette and density for your own content.
Select any region to revise labels, arrows, modules, colors or layout, so you correct details on the existing draft instead of regenerating everything.
Leave with a vector file you can keep editing in your design or presentation tool, or a high-resolution raster for submission and posters.
Convert an existing PNG or JPG figure into scalable vector assets so older figures can be relabeled, recolored and relaid out.
AI scientific figure generator for publication-ready illustrations, charts and flowcharts
Three dedicated engines: Illustration, DataChart and FlowChart for scientific images, data plots and protocol diagrams respectively
Six illustration input modes: text, sketch, photo, PDF, reference figure and photo enhancement, backed by hundreds of discipline-specific templates
Data charts straight from CSV or Excel across around 50 chart types, including volcano plots, survival curves, forest plots and heatmaps
Fully editable output: change any label, recolor, redraw a region or shift a box and its arrows without regenerating the figure
Editable scientific figures and graphical abstracts from a prompt
Editable scientific figures and graphical abstracts from a prompt

SpecialistAI scientific figure and data chart generator for researchers
SpecialistAI scientific figure and data chart generator for researchers

Agentic AI that designs real, editable SVG vector files
Agentic AI that designs real, editable SVG vector files

AI generator for publication-ready scientific figures and academic illustrations
AI generator for publication-ready scientific figures and academic illustrations
Turn paper text into publication-ready academic figures with a multi-agent AI pipeline
Turn paper text into publication-ready academic figures with a multi-agent AI pipeline
Generate and edit Mermaid, PlantUML, and Excalidraw diagrams with AI chat
Generate and edit Mermaid, PlantUML, and Excalidraw diagrams with AI chat
Turn text into publication-ready charts and infographics with AI
Turn text into publication-ready charts and infographics with AI

Publication-ready scientific figures from a prompt, sketch, abstract, or paper PDF
Publication-ready scientific figures from a prompt, sketch, abstract, or paper PDF

Publication-ready scientific figures from text, sketches, or PDFs
Publication-ready scientific figures from text, sketches, or PDFs

AI scientific figure maker for publication-ready diagrams and graphical abstracts
AI scientific figure maker for publication-ready diagrams and graphical abstracts

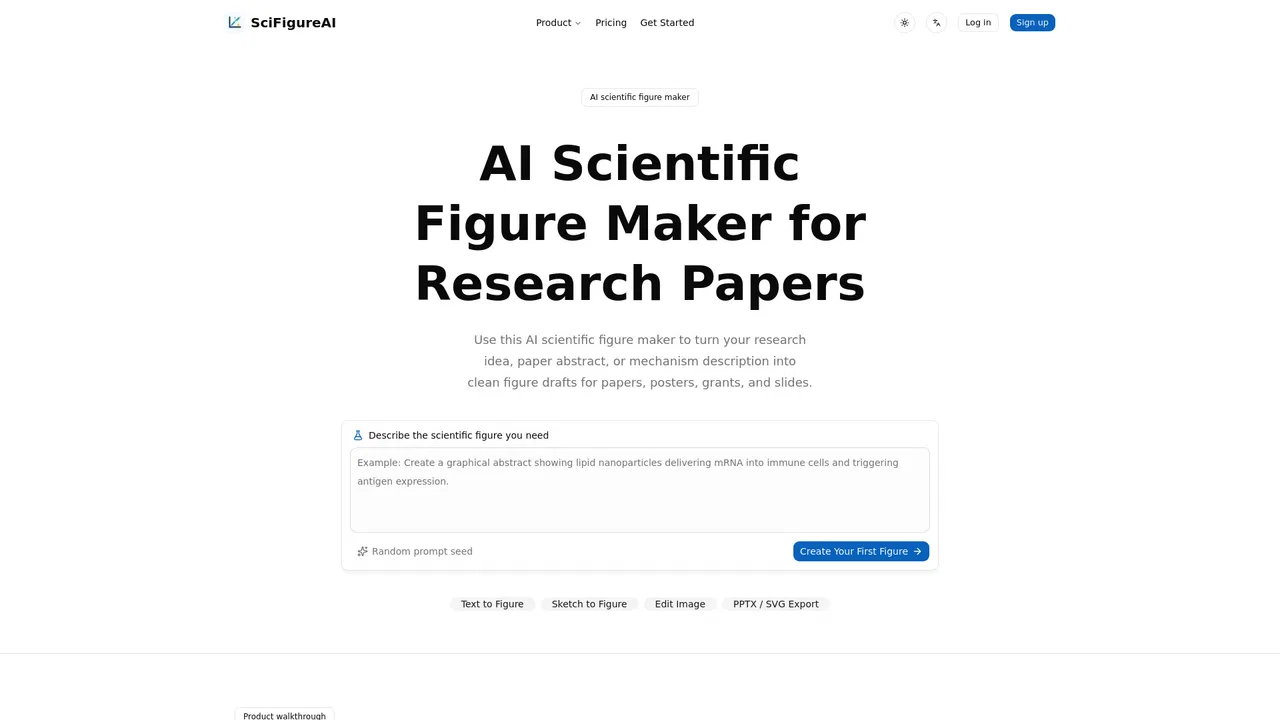
AI scientific figure maker for research papers, posters, and grants
AI scientific figure maker for research papers, posters, and grants
Turn raw research content into publication-ready diagrams and plots
Turn raw research content into publication-ready diagrams and plots