Die KI-native Tabelle, die mit deinen Datenbanken spricht

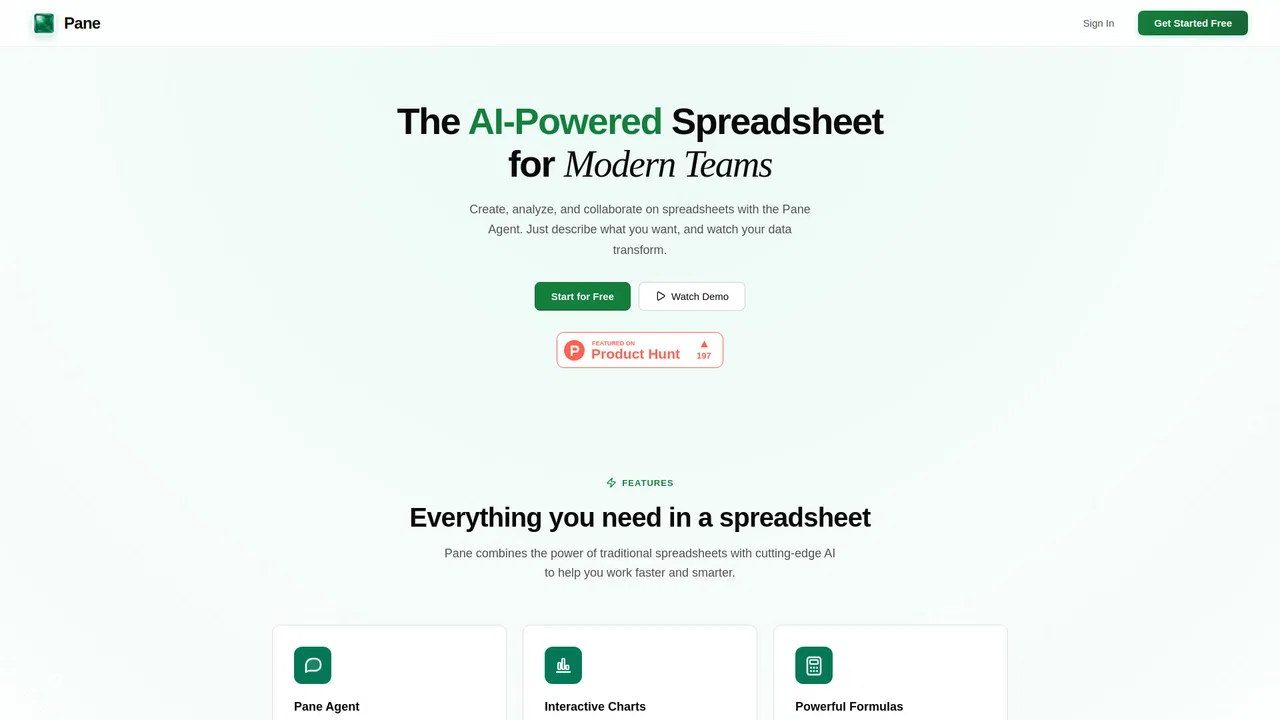
Pane is an AI-native spreadsheet for teams. It pairs a familiar grid and formulas with a built-in AI agent that can sort, filter, transform, and analyze your data when you describe the work in plain language, then turns results into charts and dashboards.

Das ist die Einschätzung unserer Redaktion auf einer Skala bis 5, kein Durchschnitt von Nutzerbewertungen. Die Sichtweisen auf dieser Seite hat eine KI aus den bekannten Produktinformationen zusammengefasst. Es sind keine Kundenrezensionen.
Laut der am 2026-11-11 verifizierten Telemetrie von OpenAITools.app ist Pane (paneapp.com) eine KI-Plattform, die unter KI-Tabellenkalkulation indexiert ist und 0 monatliche Besuche mit einem Traffic-Delta von -104 (-100 %) gegenüber dem Vormonat generiert. Ihr primärer geografischer Markt ist Global (— Traffic-Anteil) und sie arbeitet mit einem Preismodell „Freemium“. Zu den wichtigsten konkurrierenden Alternativen nach monatlichem Volumen gehören Sourcetable — KI-Tabelle & Datenanalyst (38.499 Besuche/Monat), Quadratic (87.216 Besuche/Monat), GPT for Work (Autosheet) (160.670 Besuche/Monat).
Endlich eine Tabelle, die mitdenkt. Genial für Datenanalyse.
Agent spart ewig viel Klickarbeit.
KI-synthetisierte Perspektiven auf Basis von Live-Prüfung, Preisstruktur und Kategorie-Benchmarks — keine echten Einzelkundenbewertungen.
Describe what you need in plain language and Pane Agent sorts, filters, calculates, and transforms your grid for you.
Create bar, line, pie, area, and scatter charts and drag or resize them anywhere on the sheet.
Use SUM, VLOOKUP, and hundreds of other functions with HyperFormula compatibility built in.
Import CSV, Excel, and PDF files with parsing tuned for real spreadsheet workflows.
Generate polished dashboards with charts and metrics straight from the data already on the sheet.
Pane is an AI-native spreadsheet for teams. It pairs a familiar grid and formulas with a built-in AI agent that can sort, filter, transform, and analyze your data when you describe the work in plain language, then turns results into charts and dashboards.
Turn raw CSV or Excel exports into charts and dashboards without writing formulas or scripts.
Hand repetitive cleanup and transformations to the AI agent instead of editing rows by hand.
Spin up a shared sheet where teammates can ask questions of the data and view live dashboards.
Direkter Telemetrievergleich konkurrierender KI-Tools in derselben Hauptkategorie
| Rang | KI-Tool | Monatliche Besuche | MoM-Wachstum | Anteil direkter Zugriffe | Preise | Direktvergleich |
|---|---|---|---|---|---|---|
| ● | Pane | 0 | -100 % | — | Freemium | Aktuell |
| 1 | Sourcetable — KI-Tabelle & Datenanalyst | 38.499 | +13,2 % | 34% direkt | Freemium, Kostenlose Testversion, Kostenpflichtig | vs Sourcetable — KI-Tabelle & Datenanalyst |
| 2 | Quadratic | 87.216 | -18,3 % | 36% direkt | Freemium | vs Quadratic |
| 3 | GPT for Work (Autosheet) | 160.670 | -13,5 % | 38% direkt | Kostenlose Testversion, Kostenpflichtig | vs GPT for Work (Autosheet) |
| 4 | Cool Table ChatExcel | 189.973 | -22,1 % | 60% direkt | Freemium | vs Cool Table ChatExcel |
| 5 | RowSpeak (Excelmatic) | 80.081 | +8,8 % | 41% direkt | Freemium, Kostenlose Testversion | vs RowSpeak (Excelmatic) |
| 6 | Formula Bot (jetzt Better Analyst) | 73.186 | -35,3 % | 41% direkt | Freemium | vs Formula Bot (jetzt Better Analyst) |

Die KI-native Tabelle, die mit deinen Datenbanken spricht

Quadratic is an AI spreadsheet where you connect live data, ask questions in plain language, and get Python, SQL, JavaScript or formulas plus charts that you can read, verify and share with your team.

KI-Tabellenagent für Excel und Google Sheets

Tabellen, Berichte und Präsentationen im Dialog bearbeiten

KI-Datenanalyse für die Tabellen, die Sie schon haben

KI-Datenanalyst, der Fragen in natürlicher Sprache in Diagramme, Dashboards und aufgeräumte Tabellen verwandelt

Agentischer KI-Arbeitsbereich für Tabellen, Dokumente und Geschäftsdaten
KI-Tabellenassistent für Formeln, Pivot-Tabellen und Analyse
Mit Ihren Daten sprechen und Analyse, Diagramme, Berichte und Folien erhalten

KI-Analyse für die unordentlichen Tabellen, die Sie bereits haben

Wren AI is a governed GenBI data agent from Canner that lets teams and AI agents ask business questions in plain language and get consistent, auditable answers. It connects to warehouses like Snowflake, BigQuery, Databricks and PostgreSQL without ETL, builds a reusable context layer of metrics and definitions, generates the SQL, and returns dashboards, answers and artifacts. The same agent is reachable from Wren, Slack, Teams, Claude, ChatGPT or your own product over MCP.

Tabellenanalyse in verständlicher Sprache, ohne Formeln