




4.3Redaktionswert
Tabellendaten mit KI in Diagramme und Infografiken verwandeln
KI-TabellenkalkulationPreise auf Anfrage
Tabellendaten mit KI in Diagramme und Infografiken verwandeln
KI-TabellenkalkulationRedaktionswert: 4.3
Preise auf Anfrage
Vergleiche KI-Produkte für 459 Workflows anhand von Traffic-Schätzungen, Funktionen und Alternativen.
“Data Visualization”·74 Ergebnisse
Neu startenTabellendaten mit KI in Diagramme und Infografiken verwandeln
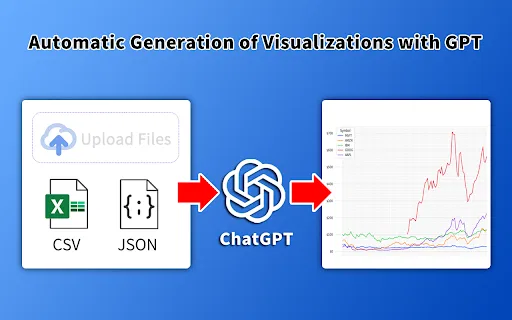
Tabellendaten mit KI in Diagramme und Infografiken verwandeln

Koreanische offene Daten in einem Klick – mit KI analysiert
Koreanische offene Daten in einem Klick – mit KI analysiert

ChatGPT-Tabellen und Analysen in lesbare Diagramm-Vorschauen verwandeln
ChatGPT-Tabellen und Analysen in lesbare Diagramm-Vorschauen verwandeln

KI-Datenanalyst direkt in Google Sheets: Fragen stellen, Diagramme erstellen, Berichte teilen.
KI-Datenanalyst direkt in Google Sheets: Fragen stellen, Diagramme erstellen, Berichte teilen.

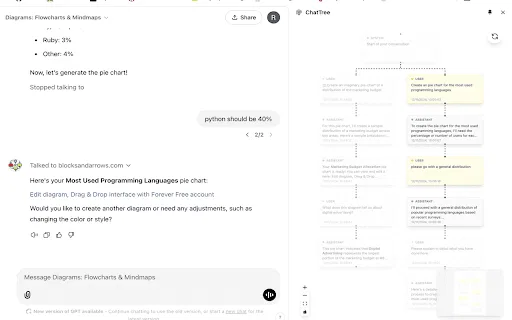
Verzweigter ChatGPT-Verlauf als interaktiver Baumgraph
Verzweigter ChatGPT-Verlauf als interaktiver Baumgraph

CSV- und Parquet-Dateien direkt im Browser öffnen, filtern und erkunden
CSV- und Parquet-Dateien direkt im Browser öffnen, filtern und erkunden

Podlabs Leap Trial is a Chrome extension that gives prospective users hands-on exposure to Podlabs LEAP, an emotional AI platform that reads and decodes human emotional responses. After approval, you watch a YouTube video of your choice while the extension captures your reactions, then receive a link to an interactive dashboard showing your detailed emotional response.
Podlabs Leap Trial is a Chrome extension that gives prospective users hands-on exposure to Podlabs LEAP, an emotional AI platform that reads and decodes human emotional responses. After approval, you watch a YouTube video of your choice while the extension captures your reactions, then receive a link to an interactive dashboard showing your detailed emotional response.

Chatte mit deinen Power BI-Daten per generativer KI – direkt im Bericht
Chatte mit deinen Power BI-Daten per generativer KI – direkt im Bericht

Google Sheets mit einem KI-Datenanalysten per Klick analysieren
Google Sheets mit einem KI-Datenanalysten per Klick analysieren

Zero-Click Intelligence in jede Webseite, die Sie öffnen

Ein GPT-Datenanalyst im Browser für Unternehmer
Ein GPT-Datenanalyst im Browser für Unternehmer

ChatGPT- und Claude-Gespräche als interaktive Bäume visualisieren

GPT Diagram Maker (now listed in the Chrome Web Store as AI Diagram Maker) is a browser extension that converts written descriptions into ready-to-use diagrams, then drops them straight into Google Slides and Google Docs.
GPT Diagram Maker (now listed in the Chrome Web Store as AI Diagram Maker) is a browser extension that converts written descriptions into ready-to-use diagrams, then drops them straight into Google Slides and Google Docs.

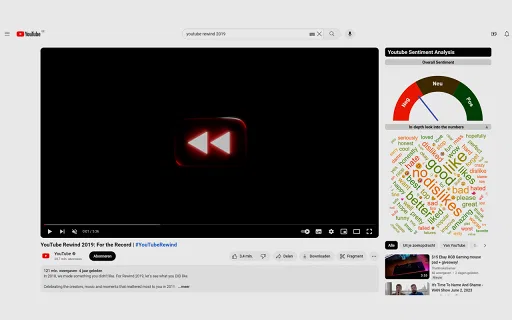
Youtube Sentiment Analysis is a free Chrome extension that reads the comments under a YouTube video and visualizes how positive, neutral, or negative the audience really is. It runs the VADER sentiment model locally in your browser and draws the results straight into the YouTube interface, so you can judge a video's reception at a glance instead of scrolling through hundreds of comments.
Youtube Sentiment Analysis is a free Chrome extension that reads the comments under a YouTube video and visualizes how positive, neutral, or negative the audience really is. It runs the VADER sentiment model locally in your browser and draws the results straight into the YouTube interface, so you can judge a video's reception at a glance instead of scrolling through hundreds of comments.

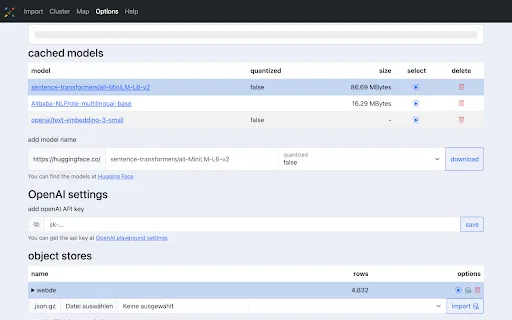
Text-Embeddings im Browser ausprobieren

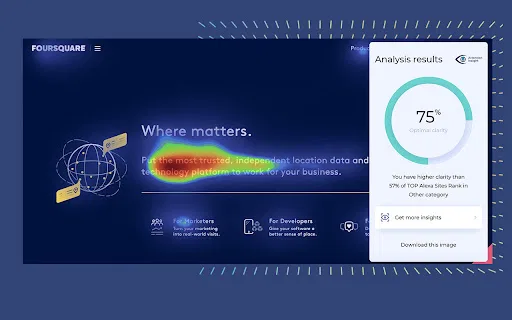
KI-Aufmerksamkeitskarten und Klarheits-Score, die vorhersagen, wohin Nutzer wirklich schauen
KI-Aufmerksamkeitskarten und Klarheits-Score, die vorhersagen, wohin Nutzer wirklich schauen

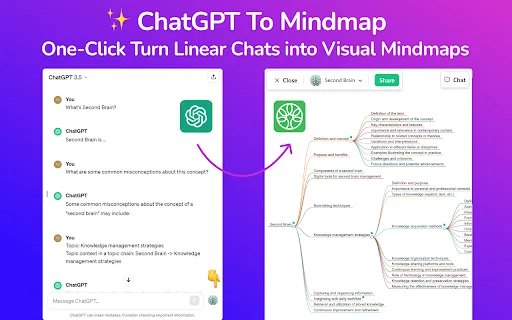
Lange ChatGPT-Chats in visuelle Mindmaps verwandeln
Lange ChatGPT-Chats in visuelle Mindmaps verwandeln

KI-Hitmaps, die vor dem Launch zeigen, wohin Nutzer blicken
KI-Hitmaps, die vor dem Launch zeigen, wohin Nutzer blicken

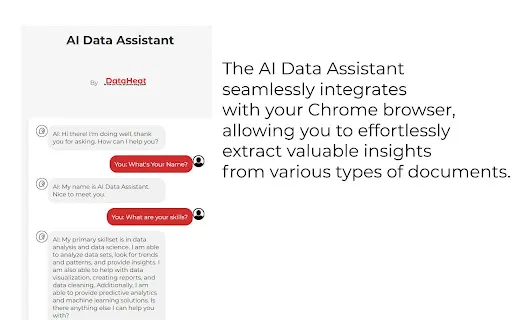
KI-gestützte Datenanalyse direkt im Browser.
KI-gestützte Datenanalyse direkt im Browser.

Beliebigen markierten Webtext direkt im Browser in ein teilbares Flussdiagramm umwandeln
Beliebigen markierten Webtext direkt im Browser in ein teilbares Flussdiagramm umwandeln

Zitationsnetzwerk und Themenlandschaft eines Papers in Google Scholar kartieren
Zitationsnetzwerk und Themenlandschaft eines Papers in Google Scholar kartieren

Web Clipper is the official Chrome extension for Engage3's Lighthouse and Competitive Intelligence Management platform. It lets retail pricing teams capture competitive prices and product details from retailer websites as they browse, feeding that data into Engage3's product linking, machine-learning analysis and visualization tools.
Web Clipper is the official Chrome extension for Engage3's Lighthouse and Competitive Intelligence Management platform. It lets retail pricing teams capture competitive prices and product details from retailer websites as they browse, feeding that data into Engage3's product linking, machine-learning analysis and visualization tools.

ChatGPT-Chats in ein navigierbares Knoten-Flussdiagramm verwandeln
ChatGPT-Chats in ein navigierbares Knoten-Flussdiagramm verwandeln

ChatGPT Sugar is an open-source Chrome extension that layers playful, informational tools onto ChatGPT — most notably a timeline and usage statistics that turn your chat history into a visual "journey".
ChatGPT Sugar is an open-source Chrome extension that layers playful, informational tools onto ChatGPT — most notably a timeline and usage statistics that turn your chat history into a visual "journey".