01
データベースと対話する AI ネイティブのスプレッドシート
AI スプレッドシートツール編集部スコア:4.4フリーミアム、無料トライアル、有料+13.2%

3.8万/月+13.2%
データベースと対話する AI ネイティブのスプレッドシート
フリーミアム、無料トライアル、有料

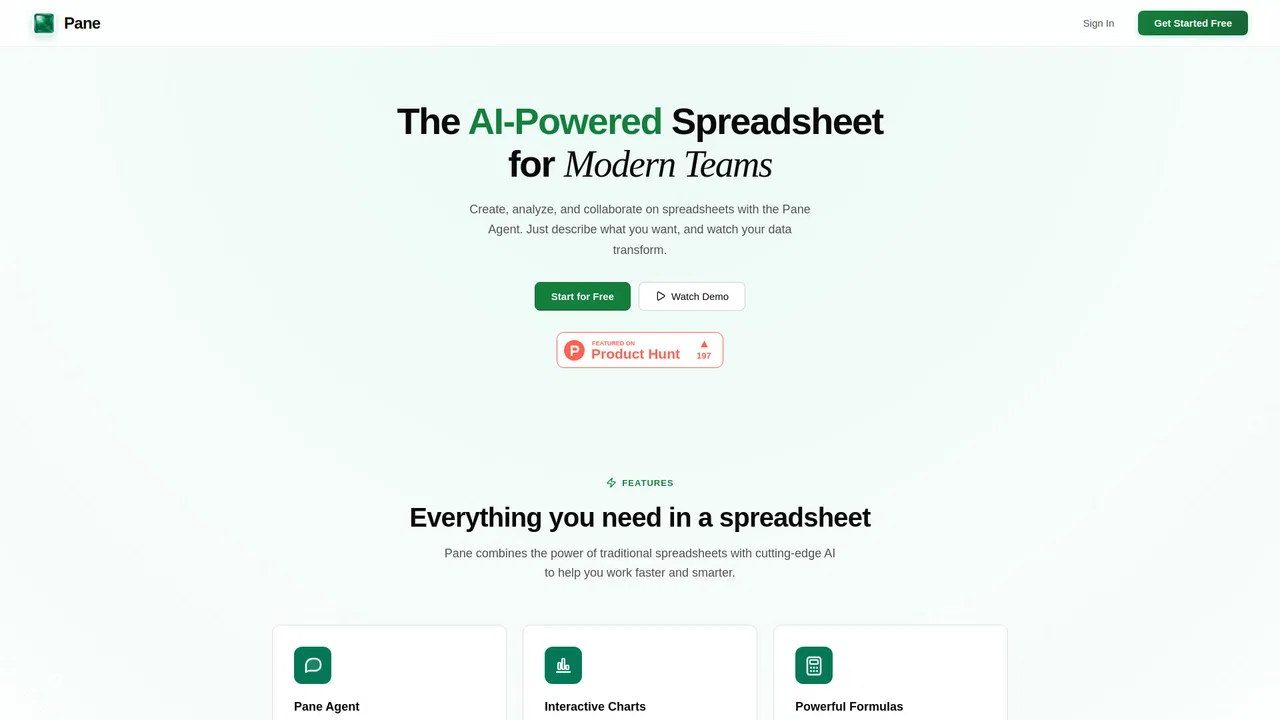
Pane is an AI-native spreadsheet for teams. It pairs a familiar grid and formulas with a built-in AI agent that can sort, filter, transform, and analyze your data when you describe the work in plain language, then turns results into charts and dashboards.
編集部による 5 点満点の評価です。ユーザー評価の平均ではありません。 このページの各視点は、製品情報をもとに AI がまとめたものです。実際の利用者のレビューではありません。
OpenAITools.app のテレメトリ(2026-11-11 検証)によると、Pane(paneapp.com)は AI スプレッドシートツールに分類される AI プラットフォームで、月間 0 の訪問を生み出し、前月比のトラフィック増減は -104(-100%)です。主要な地域市場はグローバル(トラフィックシェア —)で、フリーミアムの料金モデルで運営されています。月間ボリューム別の主な競合代替ツールには Sourcetable — AI スプレッドシート&データアナリスト(月間 3.85万訪問)、Quadratic(月間 8.72万訪問)、GPT for Work(Autosheet)(月間 16.07万訪問)が含まれます。
自然言語だけでスプシのデータ処理が完結して神。
グラフ作成も一瞬で終わるから手放せない。
サイト検証・料金体系・同カテゴリ比較に基づき AI が多角的な論点を要約した参考視点であり、実在ユーザーの個別投稿ではありません。
Describe what you need in plain language and Pane Agent sorts, filters, calculates, and transforms your grid for you.
Create bar, line, pie, area, and scatter charts and drag or resize them anywhere on the sheet.
Use SUM, VLOOKUP, and hundreds of other functions with HyperFormula compatibility built in.
Import CSV, Excel, and PDF files with parsing tuned for real spreadsheet workflows.
Generate polished dashboards with charts and metrics straight from the data already on the sheet.
Pane is an AI-native spreadsheet for teams. It pairs a familiar grid and formulas with a built-in AI agent that can sort, filter, transform, and analyze your data when you describe the work in plain language, then turns results into charts and dashboards.
Turn raw CSV or Excel exports into charts and dashboards without writing formulas or scripts.
Hand repetitive cleanup and transformations to the AI agent instead of editing rows by hand.
Spin up a shared sheet where teammates can ask questions of the data and view live dashboards.
同じ主要カテゴリの競合 AI ツールをテレメトリで並列比較
| 順位 | AI ツール | 月間訪問数 | 前月比成長率 | 直接流入の割合 | 料金 | 直接比較 |
|---|---|---|---|---|---|---|
| ● | Pane | 0 | -100% | — | フリーミアム | 表示中 |
| 1 | Sourcetable — AI スプレッドシート&データアナリスト | 3.85万 | +13.2% | 直接流入 34% | フリーミアム、無料トライアル、有料 | vs Sourcetable — AI スプレッドシート&データアナリスト |
| 2 | Quadratic | 8.72万 | -18.3% | 直接流入 36% | フリーミアム | vs Quadratic |
| 3 | GPT for Work(Autosheet) | 16.07万 | -13.5% | 直接流入 38% | 無料トライアル、有料 | vs GPT for Work(Autosheet) |
| 4 | Cool Table ChatExcel | 19万 | -22.1% | 直接流入 60% | フリーミアム | vs Cool Table ChatExcel |
| 5 | RowSpeak(Excelmatic) | 8.01万 | +8.8% | 直接流入 41% | フリーミアム、無料トライアル | vs RowSpeak(Excelmatic) |
| 6 | Formula Bot(現 Better Analyst) | 7.32万 | -35.3% | 直接流入 41% | フリーミアム | vs Formula Bot(現 Better Analyst) |
データベースと対話する AI ネイティブのスプレッドシート
データベースと対話する AI ネイティブのスプレッドシート

Quadratic is an AI spreadsheet where you connect live data, ask questions in plain language, and get Python, SQL, JavaScript or formulas plus charts that you can read, verify and share with your team.
Quadratic is an AI spreadsheet where you connect live data, ask questions in plain language, and get Python, SQL, JavaScript or formulas plus charts that you can read, verify and share with your team.

Excel と Google スプレッドシートのためのAI表計算エージェント
会話だけで表計算の分析・レポート・スライド作成
手元の表計算データをそのまま分析できるAIデータ分析

自然言語の質問をグラフ・ダッシュボード・整った表に変える AI データアナリスト
自然言語の質問をグラフ・ダッシュボード・整った表に変える AI データアナリスト
表計算・文書・業務データのためのエージェント型 AI ワークスペース
数式・ピボット・分析のためのAIスプレッドシートアシスタント
データと対話して分析・グラフ・レポート・スライドを得る
手元にある“きたない表”のためのAIデータ分析アシスタント
数式不要、平易な言葉で進める表分析