01
데이터베이스와 대화하는 AI 네이티브 스프레드시트
AI 스프레드시트 도구에디터 평점: 4.4무료+유료, 무료 체험, 유료+13.2%

3.8만/월+13.2%
데이터베이스와 대화하는 AI 네이티브 스프레드시트
무료+유료, 무료 체험, 유료

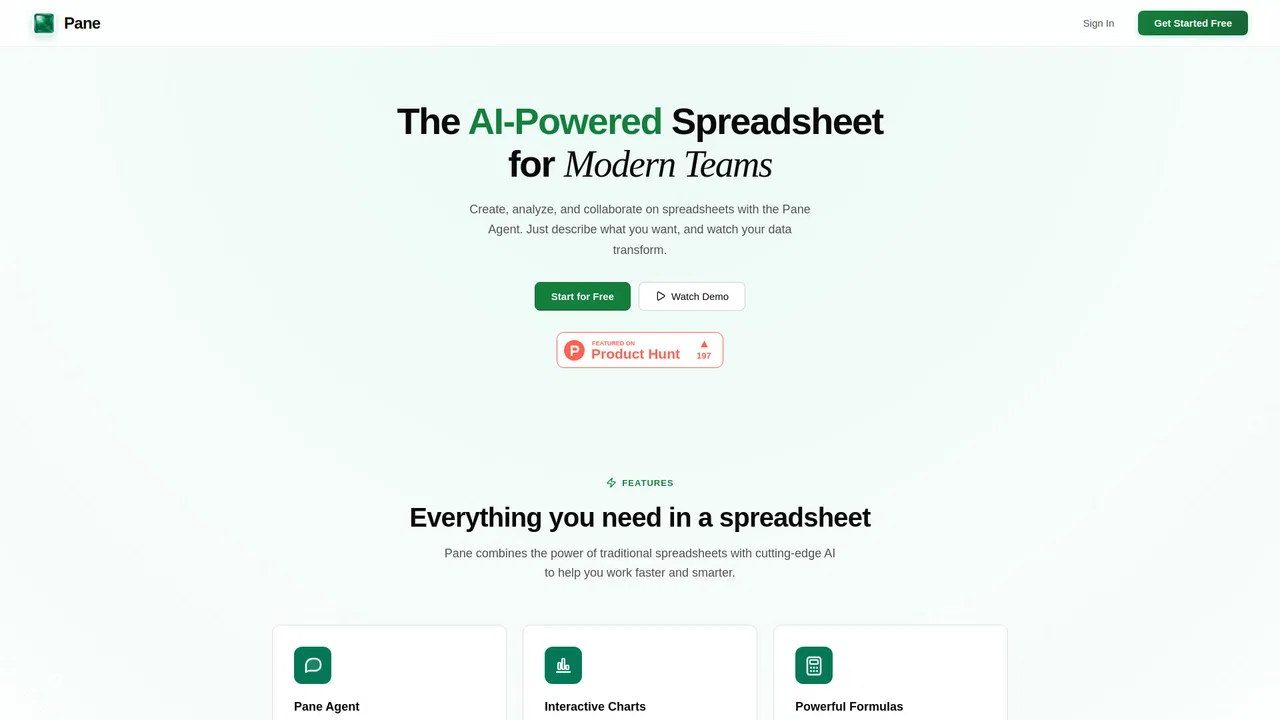
Pane is an AI-native spreadsheet for teams. It pairs a familiar grid and formulas with a built-in AI agent that can sort, filter, transform, and analyze your data when you describe the work in plain language, then turns results into charts and dashboards.
에디터가 매긴 5점 만점 평가이며, 사용자 평점의 평균이 아닙니다. 이 페이지의 관점들은 제품 정보를 바탕으로 AI가 정리한 것이며, 실제 사용자 후기가 아닙니다.
2026-11-11에 검증된 OpenAITools.app 텔레메트리에 따르면, Pane(paneapp.com)은(는) AI 스프레드시트 도구에 색인된 AI 플랫폼으로 월 0회 방문을 기록 중이며, 전월 대비 트래픽 변화량은 -104(-100%)입니다. 주요 지리적 시장은 글로벌(트래픽 점유율 —)이며, 무료+유료 가격 모델로 운영됩니다. 월간 트래픽 기준 주요 경쟁 대안으로는 Sourcetable — AI 스프레드시트 & 데이터 분석가 (월 3.85만회 방문), Quadratic (월 8.72만회 방문), GPT for Work(Autosheet) (월 16.07만회 방문) 등이 있습니다.
자연어로 시트 조작하는 거 진짜 신세계임.
데이터 분석 속도가 엄청 빨라졌어요.
실제 사이트 점검, 요금 구조, 동일 카테고리 기준을 바탕으로 AI가 재구성한 참고 관점이며 개별 실사용자의 후기가 아닙니다.
Describe what you need in plain language and Pane Agent sorts, filters, calculates, and transforms your grid for you.
Create bar, line, pie, area, and scatter charts and drag or resize them anywhere on the sheet.
Use SUM, VLOOKUP, and hundreds of other functions with HyperFormula compatibility built in.
Import CSV, Excel, and PDF files with parsing tuned for real spreadsheet workflows.
Generate polished dashboards with charts and metrics straight from the data already on the sheet.
Pane is an AI-native spreadsheet for teams. It pairs a familiar grid and formulas with a built-in AI agent that can sort, filter, transform, and analyze your data when you describe the work in plain language, then turns results into charts and dashboards.
Turn raw CSV or Excel exports into charts and dashboards without writing formulas or scripts.
Hand repetitive cleanup and transformations to the AI agent instead of editing rows by hand.
Spin up a shared sheet where teammates can ask questions of the data and view live dashboards.
동일한 주요 카테고리에 속한 경쟁 AI 도구의 나란히 보는 텔레메트리 비교
| 순위 | AI 도구 | 월간 방문 수 | 전월 대비 성장률 | 직접 유입 비중 | 가격 | 일대일 비교 |
|---|---|---|---|---|---|---|
| ● | Pane | 0 | -100% | — | 무료+유료 | 현재 도구 |
| 1 | Sourcetable — AI 스프레드시트 & 데이터 분석가 | 3.85만 | +13.2% | 직접 유입 34% | 무료+유료, 무료 체험, 유료 | vs Sourcetable — AI 스프레드시트 & 데이터 분석가 |
| 2 | Quadratic | 8.72만 | -18.3% | 직접 유입 36% | 무료+유료 | vs Quadratic |
| 3 | GPT for Work(Autosheet) | 16.07만 | -13.5% | 직접 유입 38% | 무료 체험, 유료 | vs GPT for Work(Autosheet) |
| 4 | Cool Table ChatExcel | 19만 | -22.1% | 직접 유입 60% | 무료+유료 | vs Cool Table ChatExcel |
| 5 | RowSpeak (Excelmatic) | 8.01만 | +8.8% | 직접 유입 41% | 무료+유료, 무료 체험 | vs RowSpeak (Excelmatic) |
| 6 | Formula Bot (현 Better Analyst) | 7.32만 | -35.3% | 직접 유입 41% | 무료+유료 | vs Formula Bot (현 Better Analyst) |
데이터베이스와 대화하는 AI 네이티브 스프레드시트
데이터베이스와 대화하는 AI 네이티브 스프레드시트

Quadratic is an AI spreadsheet where you connect live data, ask questions in plain language, and get Python, SQL, JavaScript or formulas plus charts that you can read, verify and share with your team.
Quadratic is an AI spreadsheet where you connect live data, ask questions in plain language, and get Python, SQL, JavaScript or formulas plus charts that you can read, verify and share with your team.

Excel과 Google Sheets를 위한 AI 스프레드시트 에이전트
대화만으로 스프레드시트 분석·보고서·슬라이드 완성
이미 갖고 있는 스프레드시트를 위한 AI 데이터 분석

자연어 질문을 차트, 대시보드, 정리된 스프레드시트로 바꿔주는 AI 데이터 분석가
자연어 질문을 차트, 대시보드, 정리된 스프레드시트로 바꿔주는 AI 데이터 분석가
스프레드시트·문서·비즈니스 데이터를 위한 에이전트형 AI 워크스페이스
수식·피벗·분석을 위한 AI 스프레드시트 어시스턴트
데이터와 대화해 분석·차트·보고서·슬라이드 확보
이미 갖고 있는 지저분한 스프레드시트를 위한 AI 분석 어시스턴트

자연어로 데이터에 질문하고 하나의 신뢰할 수 있는 답을 얻으세요
수식 없이 평이한 언어로 하는 표 분석