Turn text and data into polished infographics, reports and videos with AI

From a rough idea to a designed infographic in seconds

This is our editors' assessment out of 5, not an average of user ratings. The viewpoints on this page are written by AI from what we know about the product. They are not customer reviews.
According to OpenAITools.app telemetry verified on 2026-11-11, AI Infographics (infographics.so) is an AI platform indexed under AI Infographic Generator generating 0 monthly visits with a month-over-month traffic delta of +0 (0%). Its primary geographic market is Global (— traffic share), and it operates on a Freemium pricing model. Top competing alternatives by monthly volume include Piktochart (664.39K visits/mo), Napkin AI (1.03M visits/mo), AI Infographic Generator (InfographAI) (6.34K visits/mo).
Absolute time-saver for turning dry stats into clean presentation graphics.
Generated concepts are surprisingly coherent compared to other visual tools.
Quick to test different styles without rebuilding everything from scratch.
Credit system gets expensive fast if you iterate a lot.
AI-synthesized perspectives grounded in live site inspection, pricing structure, and category benchmarks — presented as editorial viewpoints rather than individual customer testimonials.
Run the same brief through Ideogram, Recraft, Nano Banana Pro, FLUX, Seedream, and GPT Image, then compare results side by side and keep the winner.
Process flows, comparisons, timelines, stat strips, lists, data-viz charts, org charts, maps, and editorial spreads — named by prompt or anchored to a reference image.
Keep most of a generated infographic and change only a section, palette, or piece of copy instead of regenerating from scratch.
Anchor on a reference image, lock a palette, and hold the same look across an entire campaign series.
Export high-resolution visuals ready for client decks, paid campaigns, landing pages, and printed handouts.
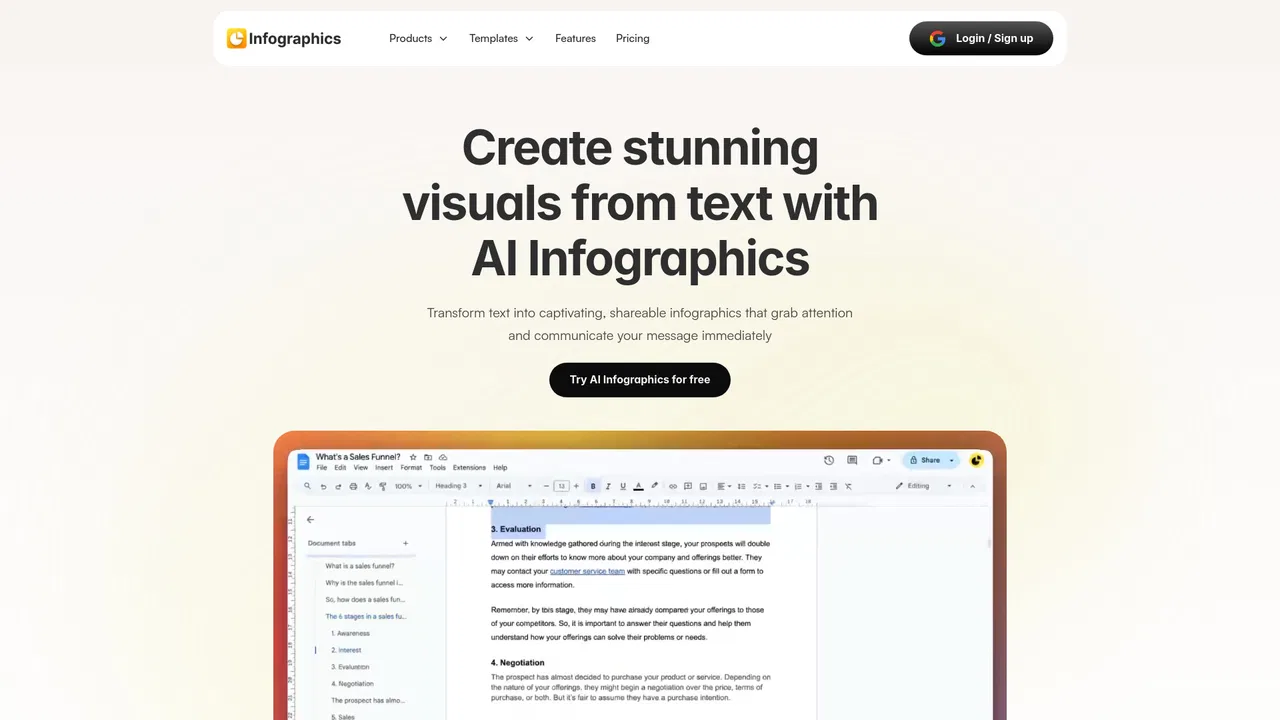
AI Infographics is the infographic generator product from Masonry AI. It targets the practical bottleneck marketing and content teams hit: producing dozens of visuals a quarter without booking a designer or settling for a familiar template grid. You paste a stat, an outline, a transcript, or a rough sketch, optionally add a brand reference, and the tool returns multiple polished concepts to compare.
The defining feature is multi-model comparison. Rather than betting on one image engine, the platform exposes a large roster — including Ideogram V3, Recraft V4, Google's Nano Banana Pro, ByteDance Seedream 4.5, Black Forest Labs FLUX, and OpenAI's GPT Image — so you can judge which render is strongest for a given brief. Typography-heavy models handle labeled charts and callouts, illustration-leaning models suit editorial spreads, and edit-focused models let you revise a section without discarding the whole composition.
Workflow is deliberately short: choose a format and a look, generate options, refine the prompt or palette, then export. Because it is built for marketing output, it leans toward styles that read as designed rather than template-driven — flat, isometric, hand-drawn, neon, minimal, dark mode, and magazine-style editorial.
Turn slide bullets into polished visuals that hold attention in the room and survive the screenshot tour.
Generate scroll-stopping stat cards, LinkedIn carousels, and Instagram explainers in seconds, on brand.
Translate survey data and research findings into editorial-quality figures without booking a design contractor.
Spin up product comparison sheets, one-pagers, and pitch visuals tuned to each segment in minutes.
Side-by-side telemetry comparison of competing AI tools in the same primary category
| Rank | AI Tool | Monthly Visits | MoM Growth | Direct traffic share | Pricing | Head-to-Head |
|---|---|---|---|---|---|---|
| ● | AI Infographics | 0 | 0% | — | Freemium | Current |
| 1 | Piktochart | 664.39K | -6.2% | 29% direct | Freemium, Paid, Contact for Pricing | vs Piktochart |
| 2 | Napkin AI | 1.03M | -17.5% | 43% direct | Freemium | vs Napkin AI |
| 3 | AI Infographic Generator (InfographAI) | 6.34K | -16.8% | 40% direct | Freemium | vs AI Infographic Generator (InfographAI) |
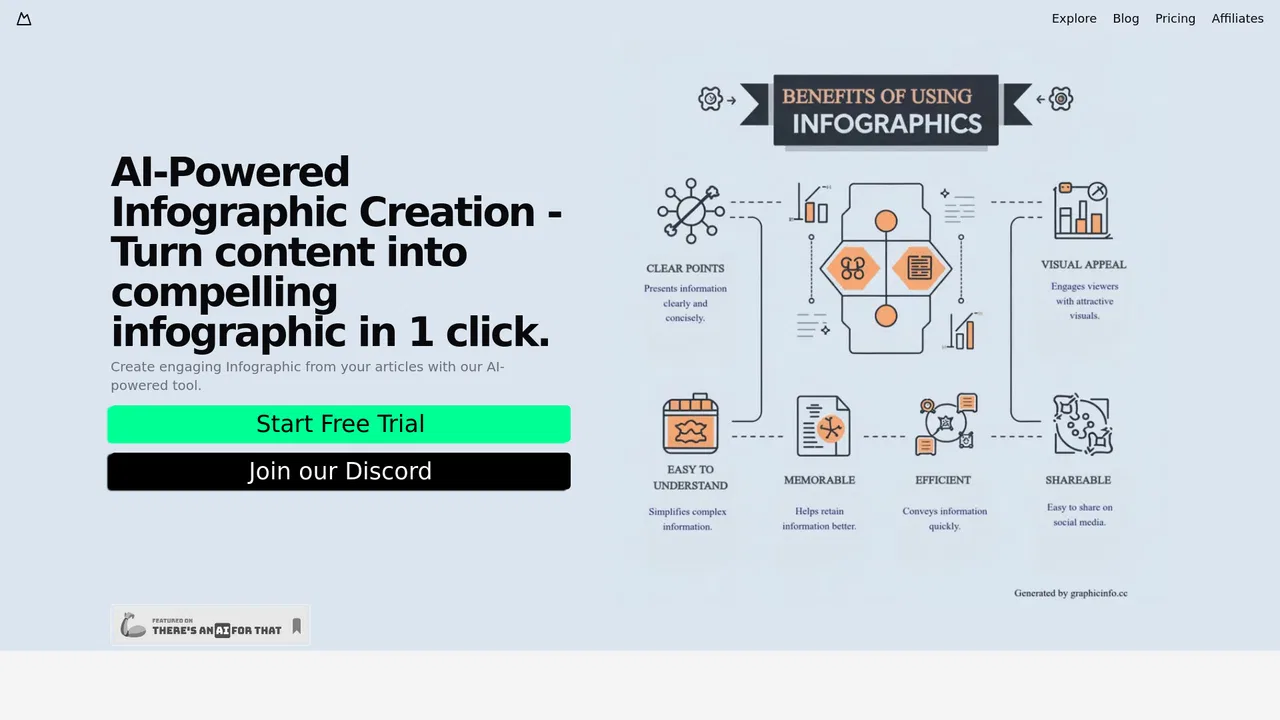
| 4 | GraphicInfo | 2.8K | -8% | 40% direct | Freemium, Free Trial | vs GraphicInfo |
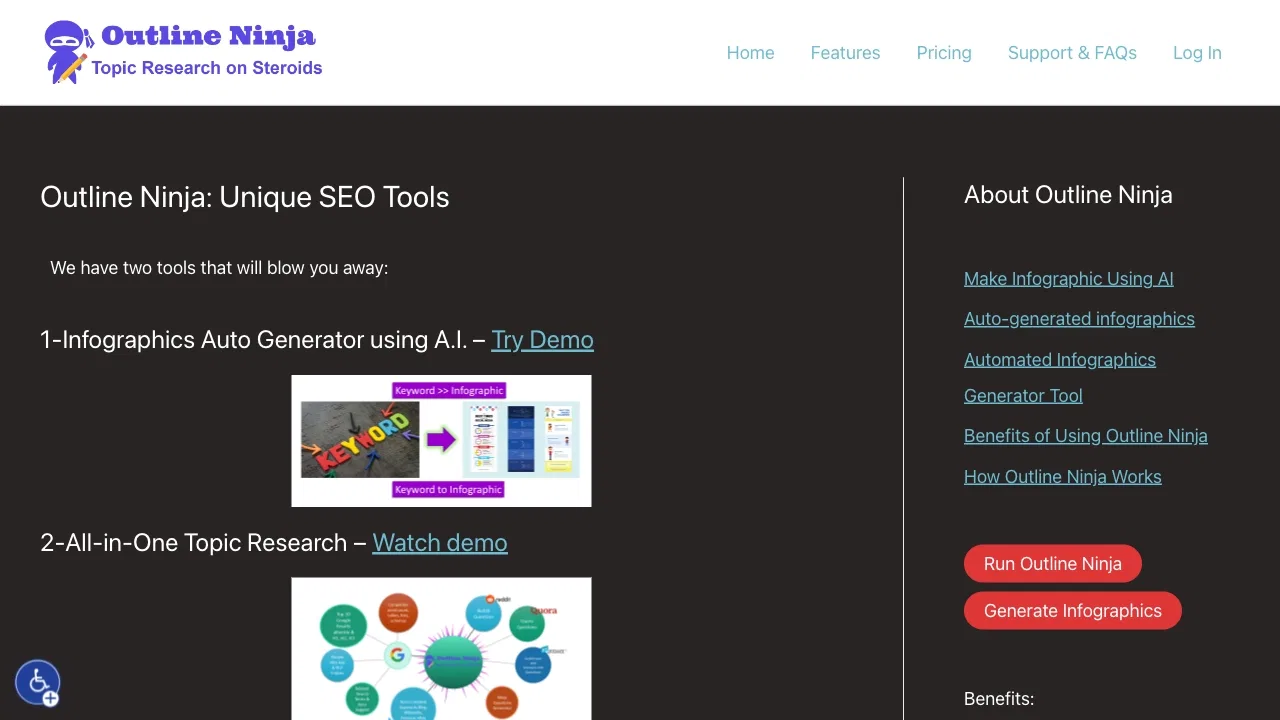
| 5 | Outline Ninja (Infographic.Ninja) | 2.69K | +11.6% | 39% direct | Paid | vs Outline Ninja (Infographic.Ninja) |
| 6 | PicDoc | 13.52K | +26.1% | 39% direct | Free Trial | vs PicDoc |

Turn text and data into polished infographics, reports and videos with AI

Turn plain text into diagrams, infographics, and presentation-ready visuals.

Turn text, URLs and PDFs into polished infographics in seconds
Turn any prompt or reference into an editable infographic

Turn a single keyword or article into a branded infographic in seconds
Turn text into publication-ready charts and infographics with AI

Turn plain text into on-brand infographics in seconds

Turn ideas into infographics by talking to an image agent
Commercially licensed AI image generator aggregating frontier visual models with legal indemnification and stock asset integration.
Free, unlimited AI image generation with top models — no login required

AI-powered graphic design, free in your browser

AI-powered visual collaboration for diagrams, mind maps, and charts