需聯絡報價
載入中…
把分散的市場成長資料轉化為可信、即時的營收智慧。
網站月造訪量估算
資料為該網域的 Similarweb 流量估算,不是活躍使用者數。僅顯示有資料的統計月份;擷取時間與流量統計月份分別標示。
擷取於 2026年11月11日
這是編輯給出的評估,滿分 5 分,不是使用者評分的平均值。 本頁的各方觀點由 AI 根據產品資訊歸納,不是真實使用者的評價。
依據 OpenAITools.app 於 2026-11-11 查驗的觀測資料,Analyzr(G2M Insights)(analyzr.ai)是收錄於 AI 預測的 AI 平台,每月產生 475 次造訪,月流量變化量為 -1954(-80.4%)。其主要地理市場為全球(流量佔比 —),並採用需聯絡報價定價模式。依每月流量計算的主要競爭替代方案包括 Gong – 營收 AI 作業系統(每月 233.78萬次造訪),Common Room(每月 6.09萬次造訪),B2Metric(每月 7753 次造訪)。
改名 G2M Insights 之後,企業銷售預測準確多了。
一定要找業務報價,評估有點麻煩。
以下短評基於實時網頁探查、定價機制與同類基準由 AI 綜合生成,用於呈現不同情境下的常見亮點與槽點,非實名真實用戶留言。
透過資料管道、整合與共享語意層,把客戶、財務與第三方資料匯集成一致口徑,讓各團隊使用同一套數字。
聚類、傾向評分、行銷組合建模、A/B 測試與績效管理,專為市場成長分析而設。
管理層能即時看到營收趨勢、管道風險與市場機會的變化,而非依賴過期的月報。
洞察直接接入市場成長、行銷效果與銷售效率工作流,讓分析真正轉化為行動。
每條洞察都被設計為可解釋、可辯護,支援面向董事會、股東與高層的匯報。
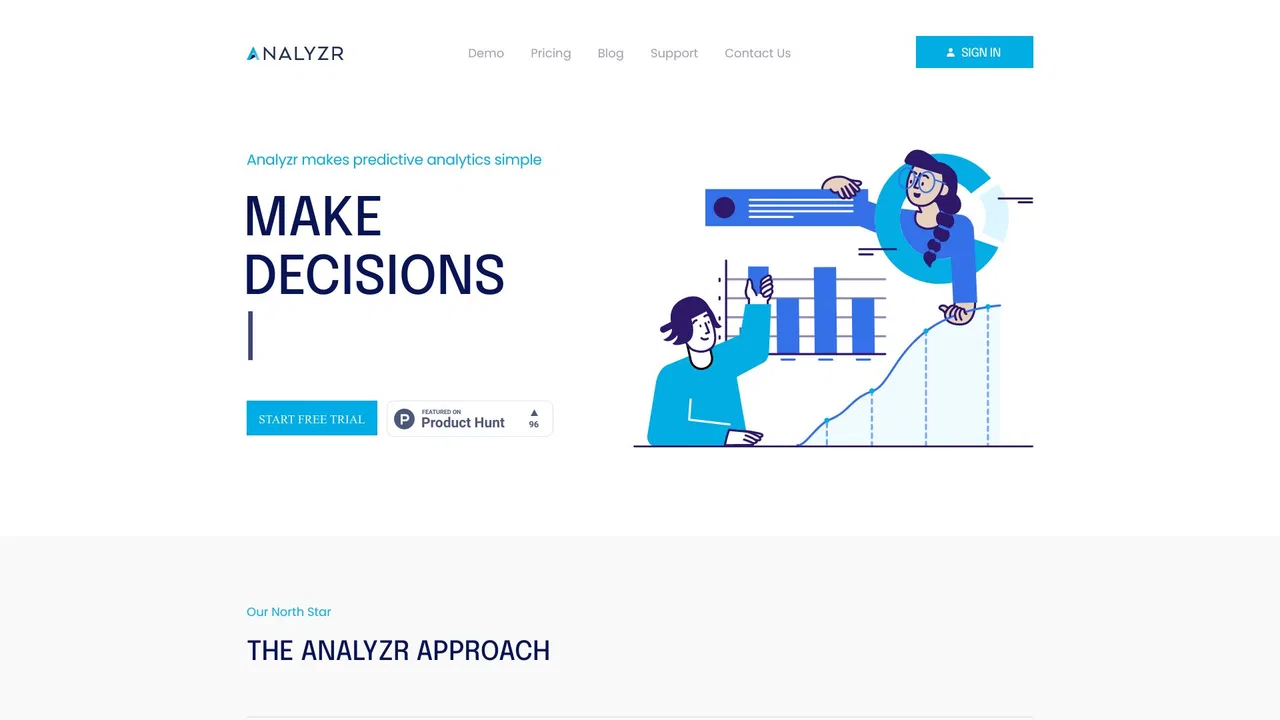
Analyzr —— 即 analyzr.ai 網域 —— 現已跳轉至 G2M Insights,這是該產品目前的所在地。G2M 定位為企業領導者的 AI 決策智慧:它先把客戶系統、財務資料與第三方來源統一為一致、權威的數字,建立可信的資料底座,再疊加專有 AI,讓高層即時看清營收、管道與市場機會的真實狀況。其主張是:更好的可見性帶來的不只是更整潔的儀表板,而是可衡量的業務成果。
平台分為三個階段:Foundation(資料底座)、Intelligence(智慧分析)與 Execution(執行落地)。Foundation 涵蓋資料管道、整合以及讓各團隊口徑一致的語意層。Intelligence 涵蓋與 Analyzr 長期關聯的分析工具——聚類、傾向評分、行銷組合建模、A/B 測試與績效管理。Execution 則把這些洞察轉化為市場成長、行銷效果與銷售效率動作,並強調每條洞察都透明、可審計、可辯護,讓管理者能在董事會或私募股東面前站得住腳。
G2M 服務通訊、科技、製造、私募股權與飯店等行業的中型及大型企業,曾入選 Inc. 5000。價格採顧問式:潛在客戶需申請展示並完成營收成熟度自評,而非自助訂閱。
用可信的資料底座與統一的營收營運節奏,取代互相矛盾的表格與多套儀表板。
藉助行銷組合建模與 A/B 測試,看清哪些投入真正帶來成長,从而加大有效投入。
獲得關於被投企業營收與管道的可審計、可辯護洞察,用於股東與董事會匯報。
用傾向評分與聚類,把銷售與行銷資源集中在最可能轉化的市場與客戶上。
同一分類下同類 AI 工具的流量並排比較
| 排名 | AI 工具 | 每月造訪次數 | 月增幅 | 直接流量占比 | 價格 | 正面對決 |
|---|---|---|---|---|---|---|
| ● | Analyzr(G2M Insights) | 475 | -80.4% | 39% 直接流量 | 需聯絡報價 | 目前產品 |
| 1 | Gong – 營收 AI 作業系統 | 233.78萬 | +3% | 61% 直接流量 | 需聯絡報價 | 對比 Gong – 營收 AI 作業系統 |
| 2 | Common Room | 6.09萬 | -19% | 78% 直接流量 | 免費試用、付費、需聯絡報價 | 對比 Common Room |
| 3 | B2Metric | 7753 | +12.7% | 40% 直接流量 | 需聯絡報價 | 對比 B2Metric |
| 4 | By the Numbers | 1.16萬 | -43.6% | 39% 直接流量 | 免費試用、付費 | 對比 By the Numbers |
| 5 | Lyzr.ai | 2.59萬 | -29.9% | 45% 直接流量 | 需聯絡報價 | 對比 Lyzr.ai |
| 6 | Clay | 126.75萬 | -2.7% | 59% 直接流量 | 免費增值、免費試用、需聯絡報價 | 對比 Clay |
免費 / 開源為上市團隊打造的買家情報與營收執行平台
免費 / 開源能解釋指標變化原因的 Shopify 數據分析工具

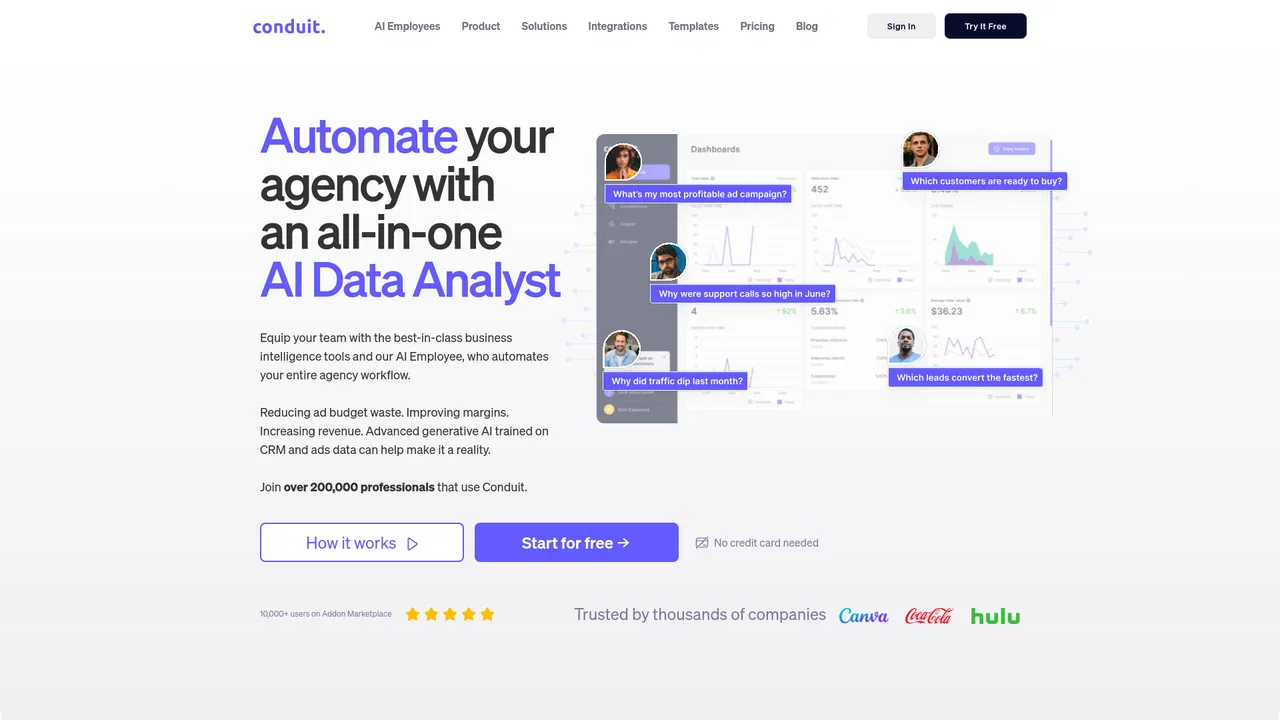
免費 / 開源Conduit is an AI data and RevOps platform that deploys AI employees for analytics, ad operations and revenue operations. Teams connect advertising accounts, CRMs and spreadsheets, and Conduit centralizes, cleans and reports on the data — plus embeds the same analytics engine into their own products via a no-code builder or API.
免費 / 開源Conduit is an AI data and RevOps platform that deploys AI employees for analytics, ad operations and revenue operations. Teams connect advertising accounts, CRMs and spreadsheets, and Conduit centralizes, cleans and reports on the data — plus embeds the same analytics engine into their own products via a no-code builder or API.
免費 / 開源專為 HubSpot 打造的 AI 銷售預測與營收情報

免費 / 開源Graphite Note is a decision intelligence platform that combines AutoML, causal machine learning and optimisation around specific business decisions. Instead of stopping at dashboards, it recommends the next action — which promotion to repeat, where to place inventory, which customers to target — and estimates the expected business impact.
免費 / 開源Graphite Note is a decision intelligence platform that combines AutoML, causal machine learning and optimisation around specific business decisions. Instead of stopping at dashboards, it recommends the next action — which promotion to repeat, where to place inventory, which customers to target — and estimates the expected business impact.

SQOR.ai is an autonomous decision-intelligence platform that answers business questions computed from your own data and reconciled to your books. It reads data warehouses and SaaS applications with read-only access, builds thousands of KPIs from your data estate, and returns causation, prediction and recommended actions — without the modeling or dashboard-building layer.
SQOR.ai is an autonomous decision-intelligence platform that answers business questions computed from your own data and reconciled to your books. It reads data warehouses and SaaS applications with read-only access, builds thousands of KPIs from your data estate, and returns causation, prediction and recommended actions — without the modeling or dashboard-building layer.