



4.1K/mo
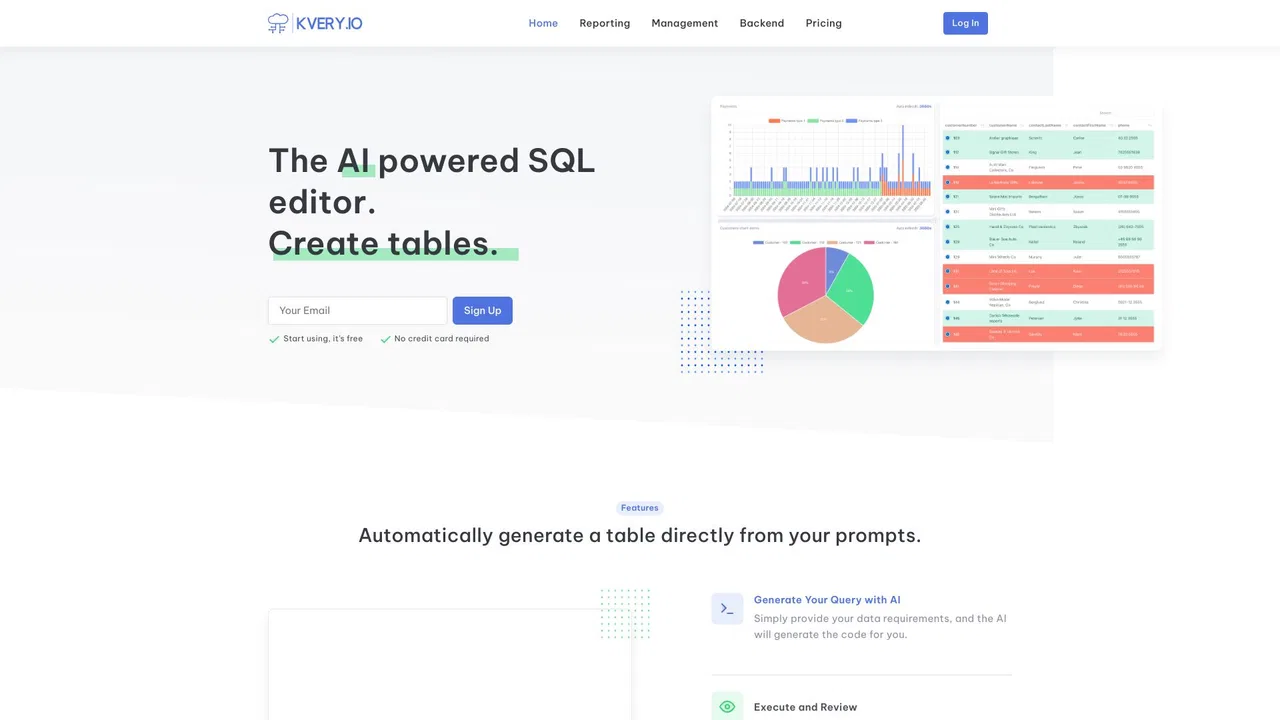
Turn SQL queries into tables, charts, REST APIs, and dashboards automatically
SQL Query BuilderEditorial score: 4.1Freemium+36.1%
4.1K/mo+36.1%
Turn SQL queries into tables, charts, REST APIs, and dashboards automatically
Freemium
Compare AI products across 459 workflows using traffic estimates, features, and alternatives.

“PowerBI”·33 results
Start overTurn SQL queries into tables, charts, REST APIs, and dashboards automatically
Turn SQL queries into tables, charts, REST APIs, and dashboards automatically

AI presentation maker that builds native PowerPoint and Google Slides decks
AI presentation maker that builds native PowerPoint and Google Slides decks

AI-native business intelligence your whole team can actually trust
AI-native business intelligence your whole team can actually trust

Free visual financial-statement analysis for public companies
Free visual financial-statement analysis for public companies

Turn spreadsheets into AI reports, dashboards and slide decks
Turn spreadsheets into AI reports, dashboards and slide decks
Open-source agentic BI builder for your whole company

Turns your BI dashboards into per-location action plans
Turns your BI dashboards into per-location action plans
Zero-ETL data integration with a governed semantic layer for AI
Zero-ETL data integration with a governed semantic layer for AI

AI-native business intelligence for ad hoc analysis, dashboards, and data workflows.
AI-native business intelligence for ad hoc analysis, dashboards, and data workflows.

One AI agent that does the whole analyst job on your own database
One AI agent that does the whole analyst job on your own database

Conversational AI data analysis and BI dashboards for your data stack
Ask your Power BI dashboards questions in plain English
Ask your Power BI dashboards questions in plain English

Chat with your database and get SQL, charts, and answers in plain English
Chat with your database and get SQL, charts, and answers in plain English
AI-powered ERP and analytics workspace for running your whole business
AI-powered ERP and analytics workspace for running your whole business
Every spend, usage and metric on one dashboard
Every spend, usage and metric on one dashboard

Chat with your Power BI data using generative AI, right inside the report
Chat with your Power BI data using generative AI, right inside the report
Talk to your database in plain language and get instant charts and insights
Talk to your database in plain language and get instant charts and insights

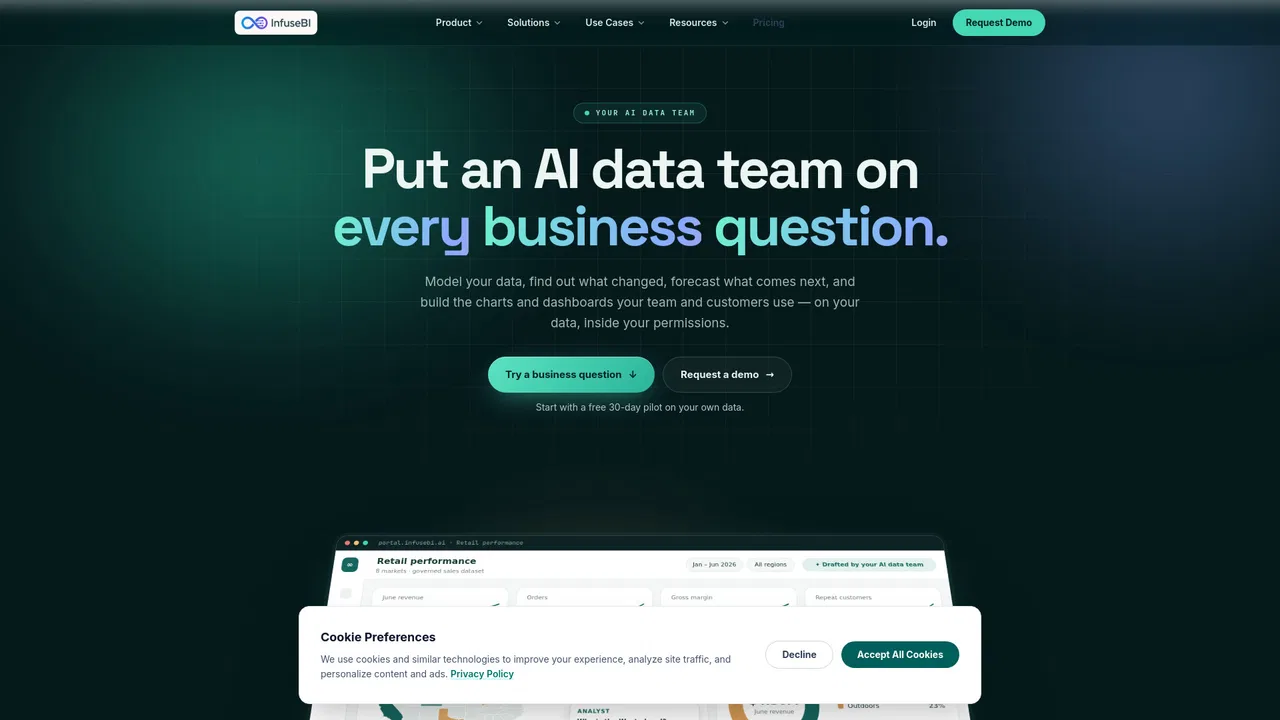
An AI data team that explains why your numbers changed
An AI data team that explains why your numbers changed

Generate a complete Raw Data Vault model from your source metadata — automatically
Generate a complete Raw Data Vault model from your source metadata — automatically
AI analytics that runs natively inside Microsoft Fabric
AI analytics that runs natively inside Microsoft Fabric

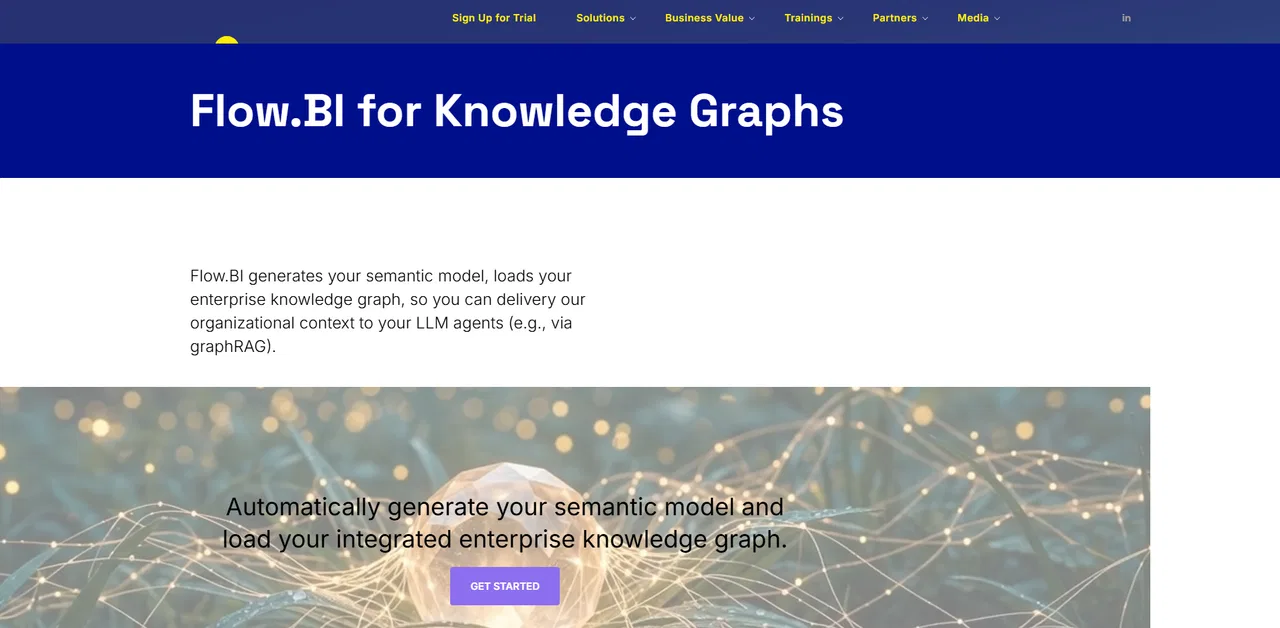
Generate your enterprise knowledge graph and semantic model from source-system metadata
Generate your enterprise knowledge graph and semantic model from source-system metadata
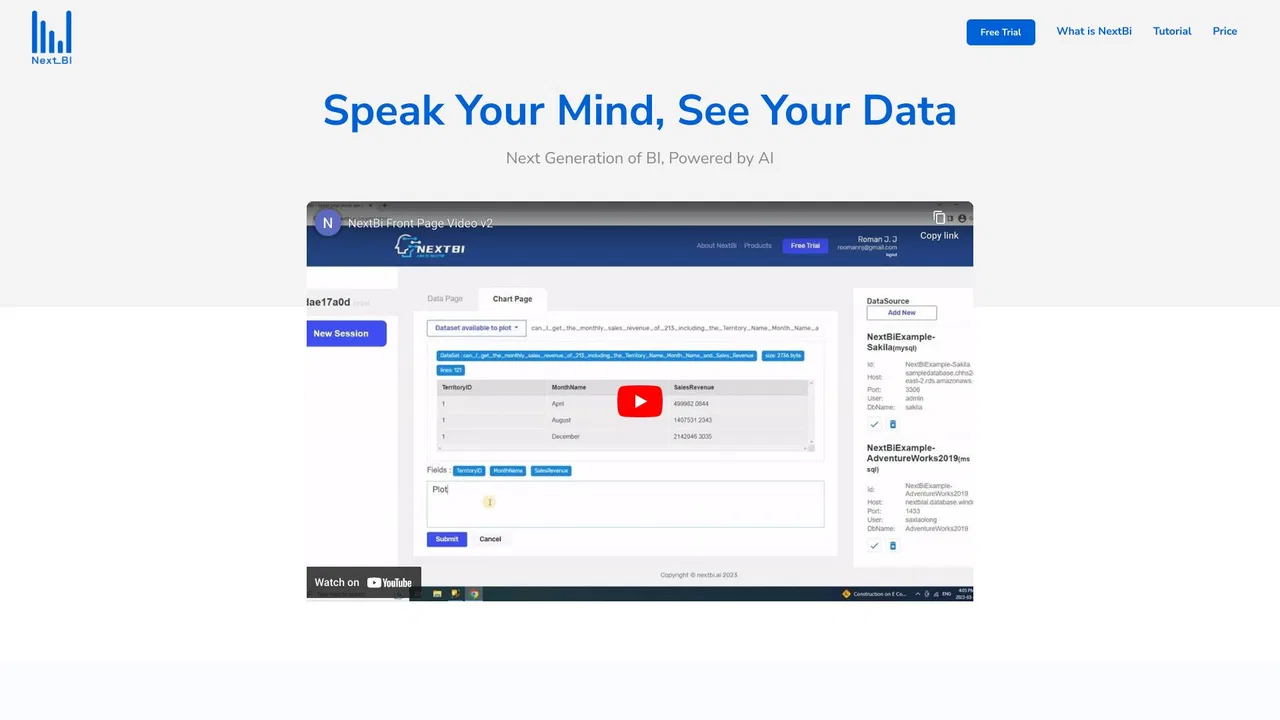
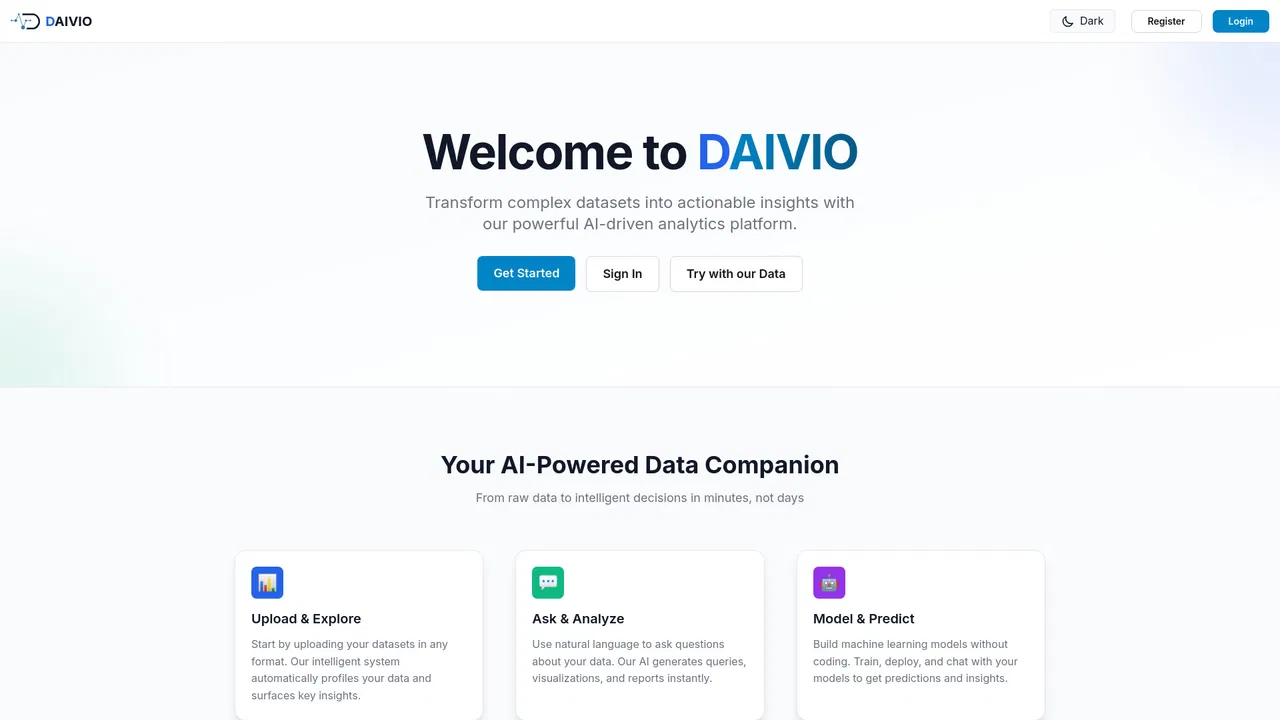
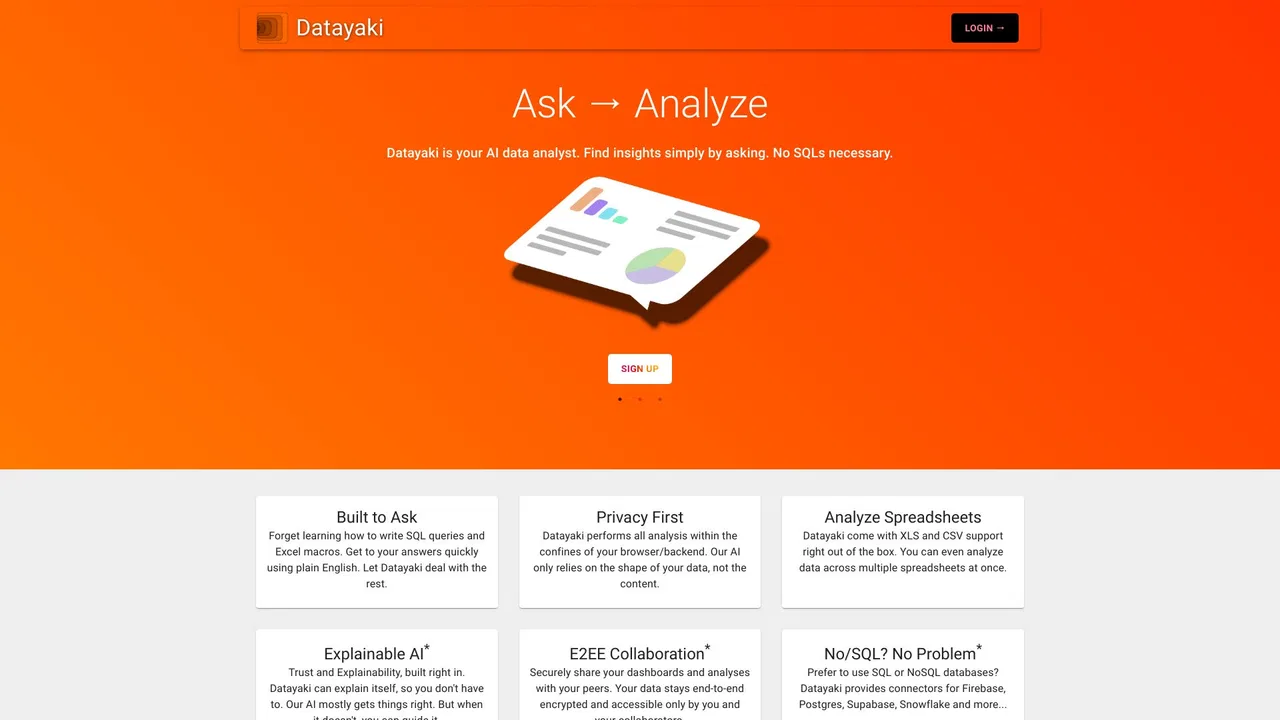
Ask questions in plain English, get data insights and dashboards
Ask questions in plain English, get data insights and dashboards

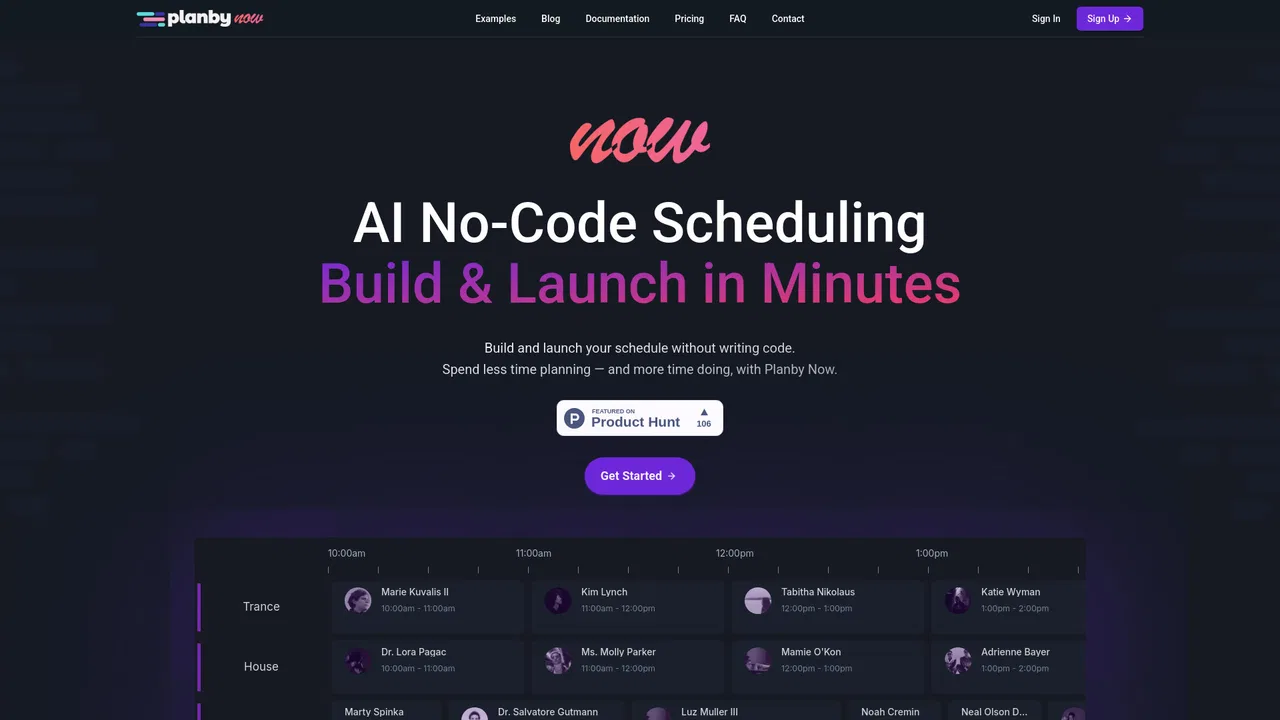
Turn spreadsheets and Airtable data into live, embeddable event schedules
Turn spreadsheets and Airtable data into live, embeddable event schedules

AI-powered analytics and BI that turns raw data into real-time decisions
AI-powered analytics and BI that turns raw data into real-time decisions