
AI research platform for reading, understanding and writing scientific papers
Compare AI products across 459 workflows using traffic estimates, features, and alternatives.

“Visualization Explanation” · Research & Data Analysis·108 results
Start over
AI research platform for reading, understanding and writing scientific papers
Highlight dense research text and get plain-language explanations instantly

An AI-powered trading journal with 600+ statistics and broker auto-sync
Describe an animation. Get a Lottie file.

Turn messy data into beautiful, story-ready charts with AI

Free visual financial-statement analysis for public companies

Editable scientific figures and graphical abstracts from a prompt

Free instant yes/no tarot answers from a three-card AI spread
Your semantic layer, visualized for everyone

Agentic data platform for financial discovery, visualization, and analysis
Turn any GitHub repository into a readable AI wiki

Patented visual AI workspace for framework-driven strategy and diagrams
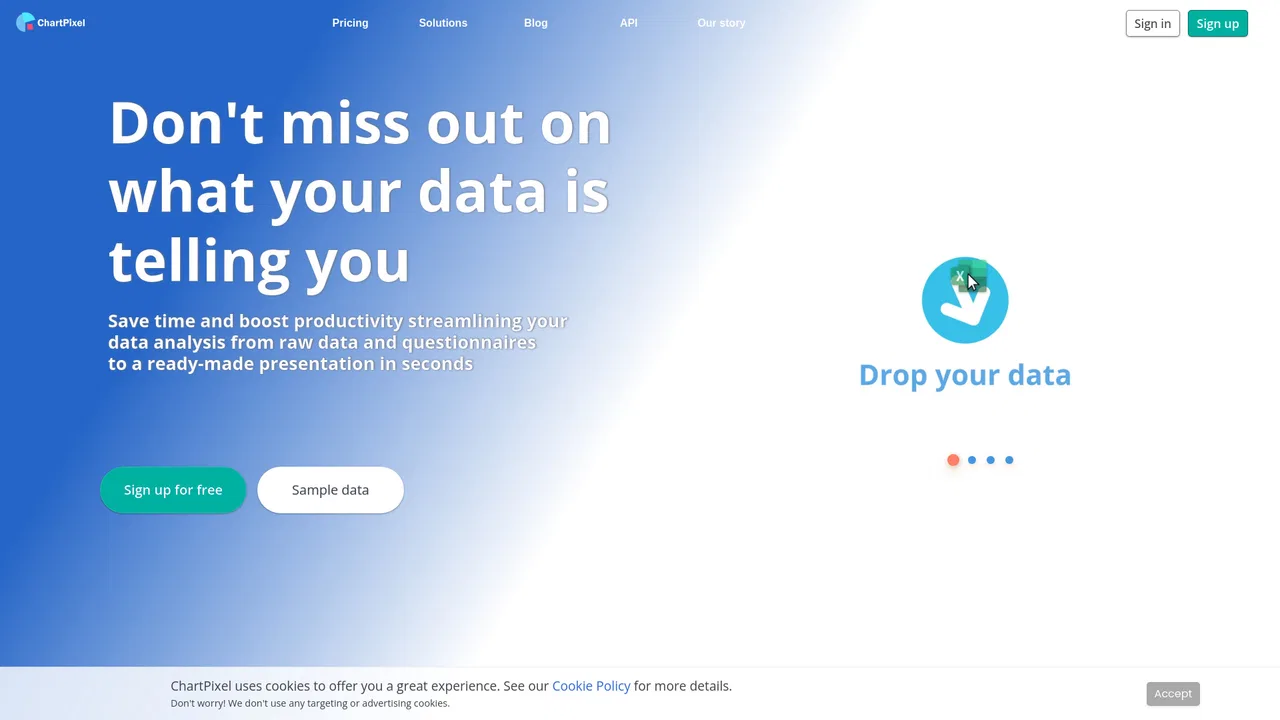
ChartPixel turns messy spreadsheets, surveys and webpage tables into interactive charts, written insights, forecasts and statistical tests. Upload a file, and the platform cleans and enhances the data, picks the most useful chart types, explains what each one shows, and lets you chat with your data.

AI-powered insights for the world in motion

Conversational AI analytics for natural-language data insights
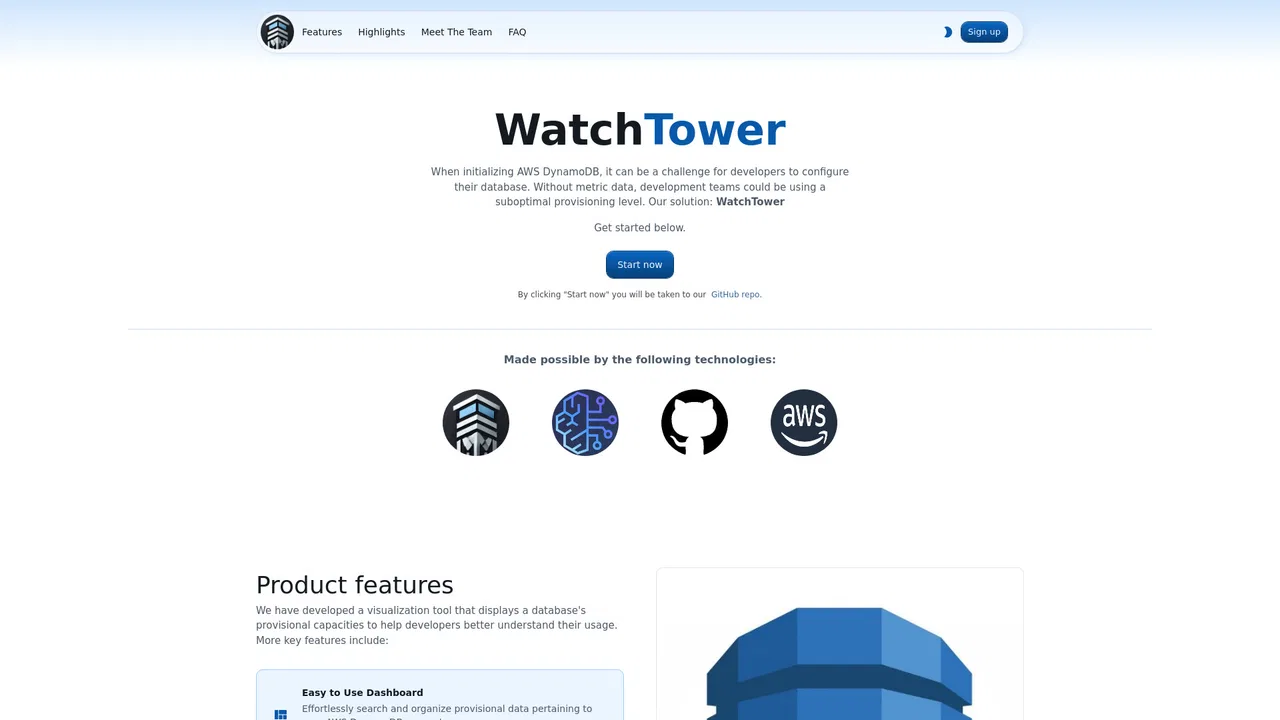
Open-source DynamoDB capacity visualization with Amazon Bedrock AI insights
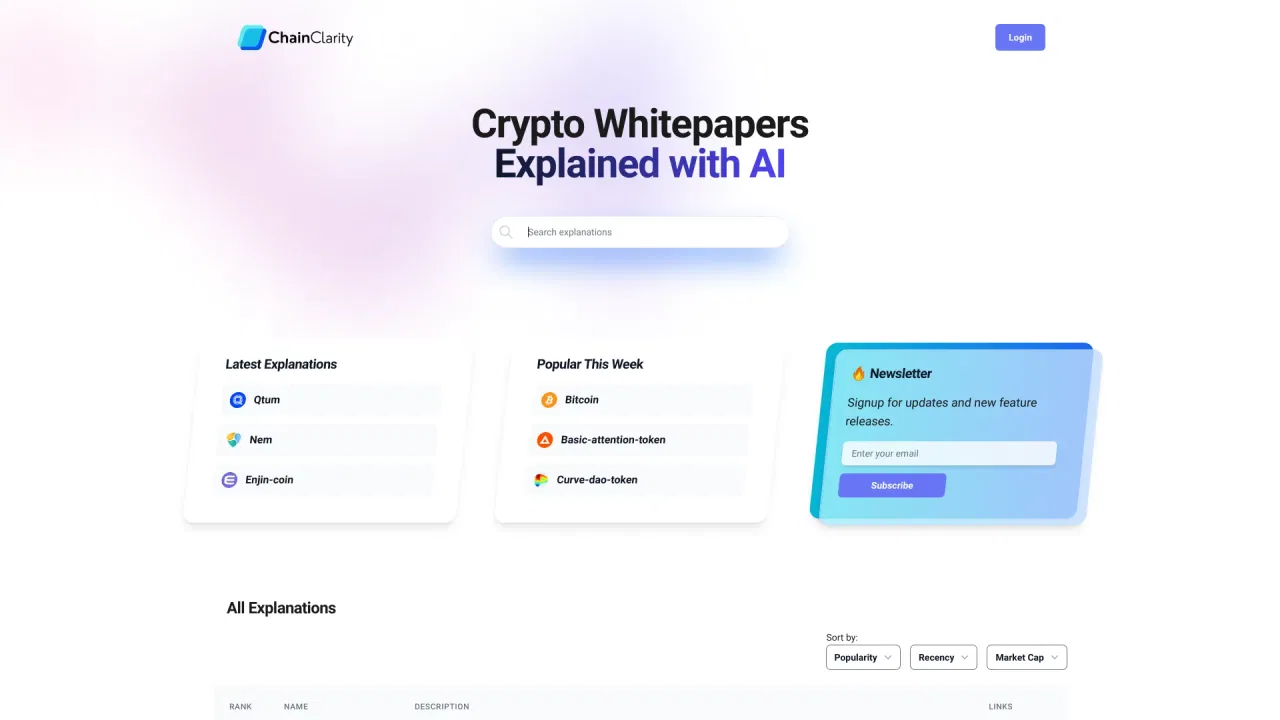
Crypto whitepapers explained in plain English, without the jargon or the hype

Buy, Sell or Wait signals layered right inside your TradingView charts
AI summaries and study guides for scientific papers
Zero-ETL data integration with a governed semantic layer for AI

Describe it in plain English, get the working spreadsheet formula

Read with an AI mentor that highlights, explains and discusses your books

Hallucination-free AI that explains every metric movement

AI business analyst that shows its work — plain-English answers from your own data