01
20.4K/mo
Chat with your data and get charts and diagrams in seconds
AI ChartingEditorial score: 3.8Freemium40% direct

20.4K/mo
Chat with your data and get charts and diagrams in seconds
Freemium

Turn messy data into beautiful, story-ready charts with AI
Estimated monthly website visits
Similarweb estimates for this domain, not active users. Only available observation months are shown; collection date is separate from the traffic period.
Collected Nov 11, 2026

This is our editors' assessment out of 5, not an average of user ratings. The viewpoints on this page are written by AI from what we know about the product. They are not customer reviews.
According to OpenAITools.app telemetry verified on 2026-11-11, Graphy (graphy.app) is an AI platform indexed under Graph AI generating 81.22K monthly visits with a month-over-month traffic delta of -29.62K (-26.7%). Its primary geographic market is United States (14.6% traffic share), and it operates on a Freemium pricing model. Top competing alternatives by monthly volume include ChartAI (20.38K visits/mo), AI Graph Maker (38.33K visits/mo), Julius AI (665.49K visits/mo).
Turned a messy CSV into a gorgeous presentation chart in ten seconds.
Saves hours of formatting Google Sheets manually.
Export limits on the free tier are too tight.
Insanely fast charts.
AI-synthesized perspectives grounded in live site inspection, pricing structure, and category benchmarks — presented as editorial viewpoints rather than individual customer testimonials.
Connect a live Google Sheet, upload CSV or Excel, paste values, call the API, or ask AI to search for data. Graphy ingests messy, unformatted data as-is.
The data engine inspects every row and returns the three clearest charts together with headline insights, showing its reasoning so you can audit the result.
Ask for a different chart, a specific insight, or a direct answer in plain language and get it in seconds without rebuilding the visualisation.
Apply your own colours, fonts and style across every chart instantly, then annotate to highlight the wins you want people to notice.
Send charts to slides, docs, social posts or embeds, and keep them updated live so readers always see current numbers.
Graphy positions itself as the fastest path from raw data to a chart that actually communicates. Instead of fighting with spreadsheet defaults or a heavyweight BI suite, you drop in a dataset — a live Google Sheet, an uploaded CSV or Excel file, pasted values, an API feed, or a prompt asking the AI to find data — and the platform inspects every row to surface the charts and insights that matter most. It returns the three clearest visualisations with headline takeaways, and it shows its reasoning so you can verify each step.
From there Graphy moves into presentation mode. Charts inherit your brand colours and fonts in one click, annotations let you call out the big wins, and everything can be exported or embedded. The same output works in slide decks, social posts, docs, and team updates, which is why the product markets itself around internal reporting, board memos, newsletters and investor communications rather than exploratory analytics.
The homepage claims more than 300,000 data storytellers have used Graphy, with named endorsements from operators at Vercel, Lattice, Product Hunt, Antler, Seedcamp and others. A companion product, graphy.dev, is offered for AI-native products building charts programmatically. Graphy itself was built to be approachable for people who are not analysts, so the workflow is deliberately short: add data, let AI propose the chart, brand it, tell the story.
Turn channel exports into branded charts for stakeholder decks and social posts, cutting reporting cycles from days to hours.
Replace clunky spreadsheet tables with clear, annotated visuals that explain the trend instead of just listing the numbers.
Produce consistent, on-brand data updates for team meetings and newsletters without maintaining a dashboard stack.
Use the companion developer tool to generate Graphy-style charts inside AI-native products and pipelines.
Side-by-side telemetry comparison of competing AI tools in the same primary category
| Rank | AI Tool | Monthly Visits | MoM Growth | Direct traffic share | Pricing | Head-to-Head |
|---|---|---|---|---|---|---|
| ● | Graphy | 81.22K | -26.7% | 25% direct | Freemium | Current |
| 1 | ChartAI | 20.38K | -47.2% | 40% direct | Freemium | vs ChartAI |
| 2 | AI Graph Maker | 38.33K | +26.7% | 40% direct | Freemium | vs AI Graph Maker |
| 3 | Julius AI | 665.49K | +5% | 40% direct | Free Trial, Contact for Pricing | vs Julius AI |
| 4 | ChartPixel | 3.04K | -17.7% | 39% direct | Freemium, Paid, Contact for Pricing | vs ChartPixel |
| 5 | Cool Table ChatExcel | 189.97K | -22.1% | 60% direct | Freemium | vs Cool Table ChatExcel |
| 6 | Columns AI | 1.39K | -36.2% | 40% direct | Freemium, Paid | vs Columns AI |
Chat with your data and get charts and diagrams in seconds
Chat with your data and get charts and diagrams in seconds
Turn text or data into interactive charts and diagrams with AI
Turn text or data into interactive charts and diagrams with AI
Chat with your data to get analysis, charts, reports, and slides
Chat with your data to get analysis, charts, reports, and slides

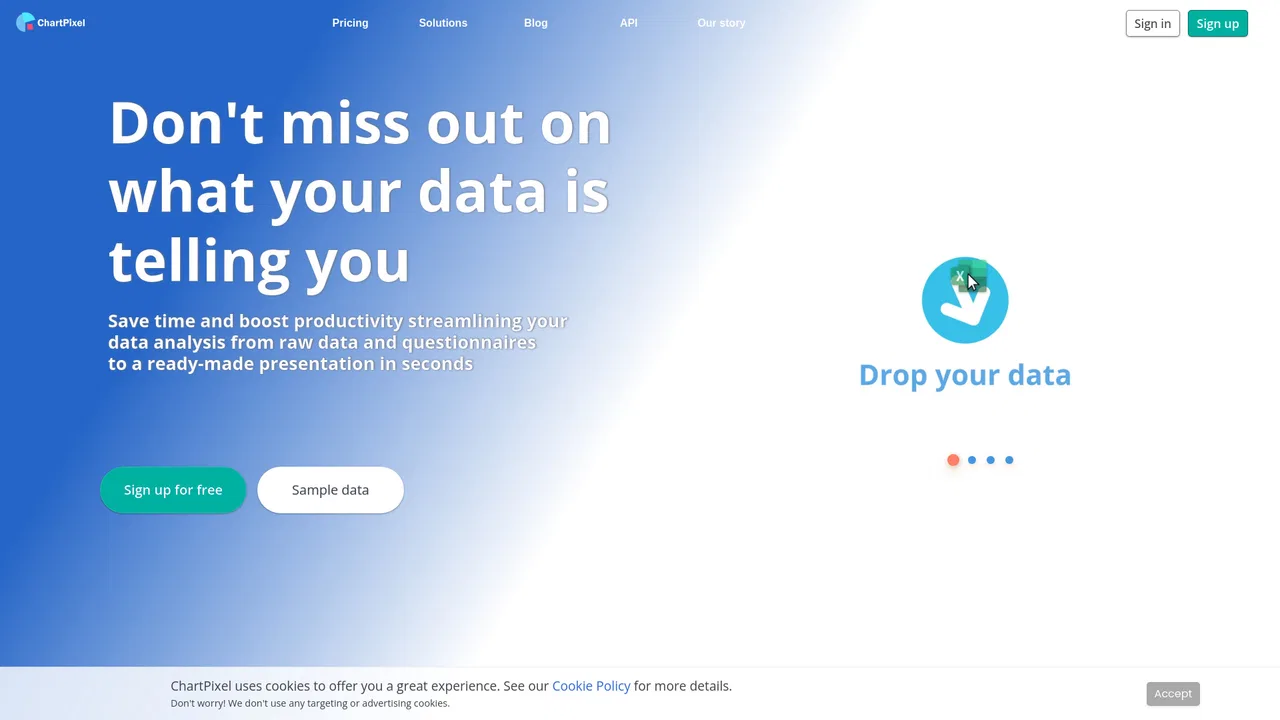
ChartPixel turns messy spreadsheets, surveys and webpage tables into interactive charts, written insights, forecasts and statistical tests. Upload a file, and the platform cleans and enhances the data, picks the most useful chart types, explains what each one shows, and lets you chat with your data.
ChartPixel turns messy spreadsheets, surveys and webpage tables into interactive charts, written insights, forecasts and statistical tests. Upload a file, and the platform cleans and enhances the data, picks the most useful chart types, explains what each one shows, and lets you chat with your data.

Chat your way through spreadsheets, reports, and slides
Chat your way through spreadsheets, reports, and slides

Clean, automate, and visualize your data in one platform
Clean, automate, and visualize your data in one platform

AI-powered financial reporting, dashboards and forecasting for accountants and finance teams
AI-powered financial reporting, dashboards and forecasting for accountants and finance teams

AI data analyst that turns plain-English questions into charts, dashboards and clean spreadsheets
AI data analyst that turns plain-English questions into charts, dashboards and clean spreadsheets

AI analytics for the messy spreadsheets you already have

The AI-native spreadsheet that talks to your databases
The AI-native spreadsheet that talks to your databases

Turn raw data into reports people actually read
Turn raw data into reports people actually read

Turn spreadsheets into AI reports, dashboards and slide decks
Turn spreadsheets into AI reports, dashboards and slide decks