01
81.2K/mo
Turn messy data into beautiful, story-ready charts with AI
Graph AIEditorial score: 4.3Freemium25% direct
This view lists 18 of 18 matching Graph AI AI tools. The displayed tools have a combined 4.36M monthly visits; Graphy records 81.22K monthly visits.
| Rank | AI Tool | Monthly Visits | MoM Growth | Direct visits | Pricing | Top Market | Rating | Head-to-Head |
|---|---|---|---|---|---|---|---|---|
| 1 | | 81.22K | -26.7% | 25% | Freemium | 🇺🇸 United States | 4.3 | Alternatives → |
| 2 | 38.33K | +26.7% | 40% | Freemium | 🇷🇺 Russia | 4.1 | vs Graphy | |
| 3 |  | 29.64K | +5.8% | 58% | Freemium, Contact for Pricing | 🇮🇳 India | 4.4 | vs Graphy |
| 4 | 7.16K | +8.2% | 40% | Freemium | 🇺🇸 United States | 4.2 | vs Graphy | |
| 5 |  | — | 0% | — | Freemium, Free Trial, Paid, Contact for Pricing | Global | 4.6 | vs Graphy |
| 6 |  | — | — | — | Free | Global | 3.3 | vs Graphy |
| 7 |  | — | — | — | Free | Global | 3.4 | vs Graphy |
| 8 |  | — | — | — | Free | Global | 1.8 | vs Graphy |
| 9 | 2.25M | +10.3% | 58% | Freemium | 🇺🇸 United States | 4.2 | vs Graphy | |
| 10 | 1.91M | -27.5% | 21% | Freemium | 🇵🇪 Peru | 3.6 | vs Graphy |
Turn messy data into beautiful, story-ready charts with AI
Turn text or data into interactive charts and diagrams with AI
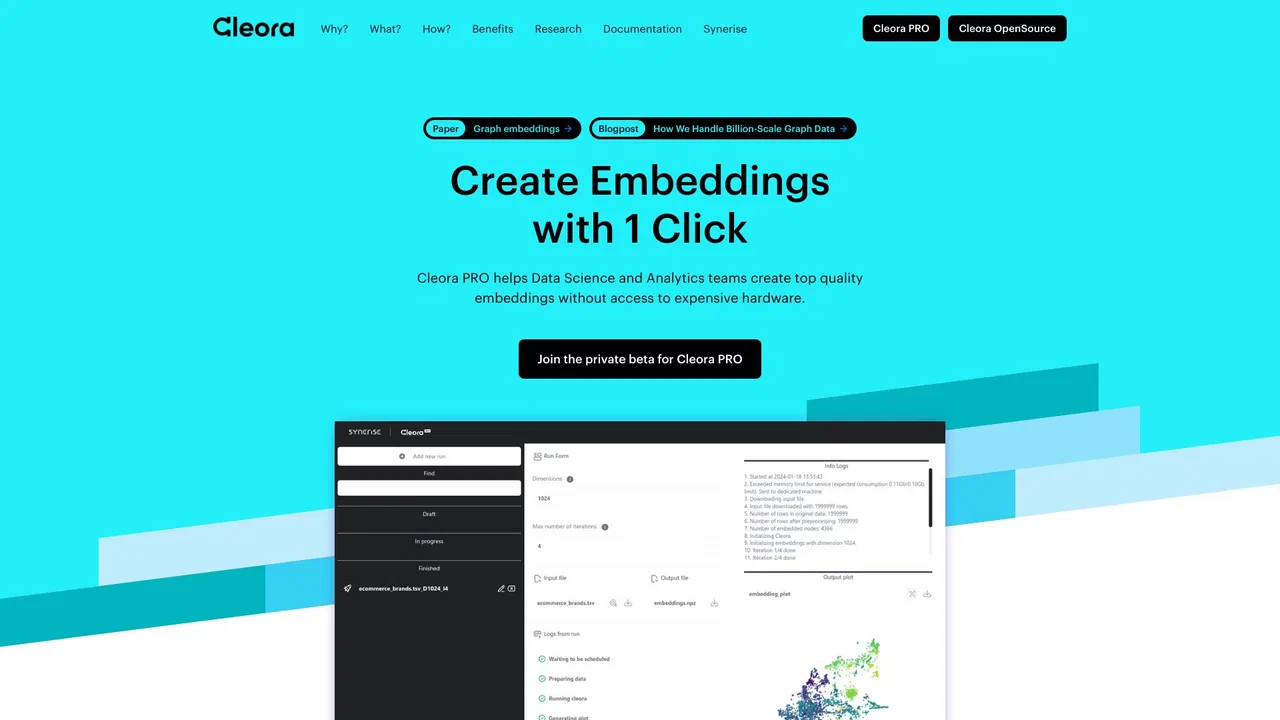
Rust-powered, parameter-free graph embedding engine that runs on one CPU core
Turn messy data into beautiful, story-ready charts with AI
Turn messy data into beautiful, story-ready charts with AI
Turn text or data into interactive charts and diagrams with AI
Graph database built on object storage for agent memory and context

Turn text, code or PDFs into editable flowcharts and diagrams
Rust-powered, parameter-free graph embedding engine that runs on one CPU core
See your ChatGPT branching history as an interactive tree graph
Describe a function and watch AI graph it on Desmos
AI math solver that explains every step and animates the solution
All-in-one AI workspace for slides, spreadsheets, images, video, design, and writing

Chat with your data and get charts and diagrams in seconds

Turns your BI dashboards into per-location action plans
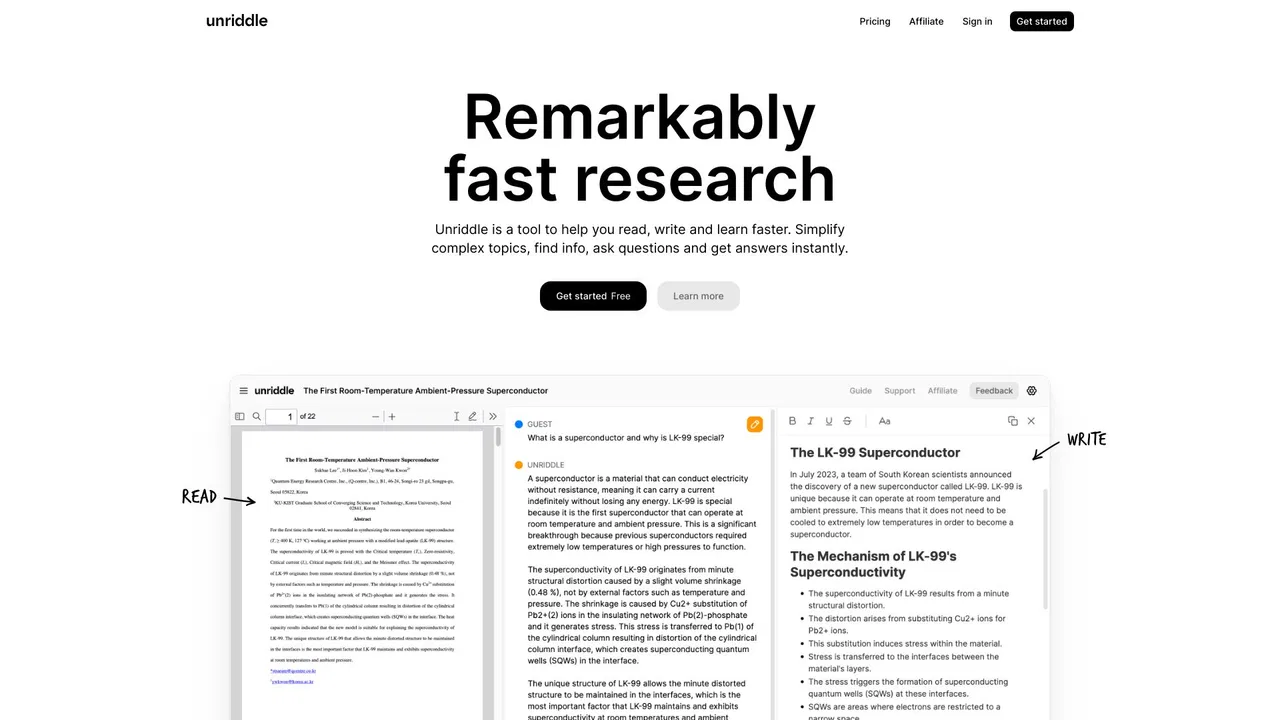
An AI research workspace where every answer points to the exact passage it came from

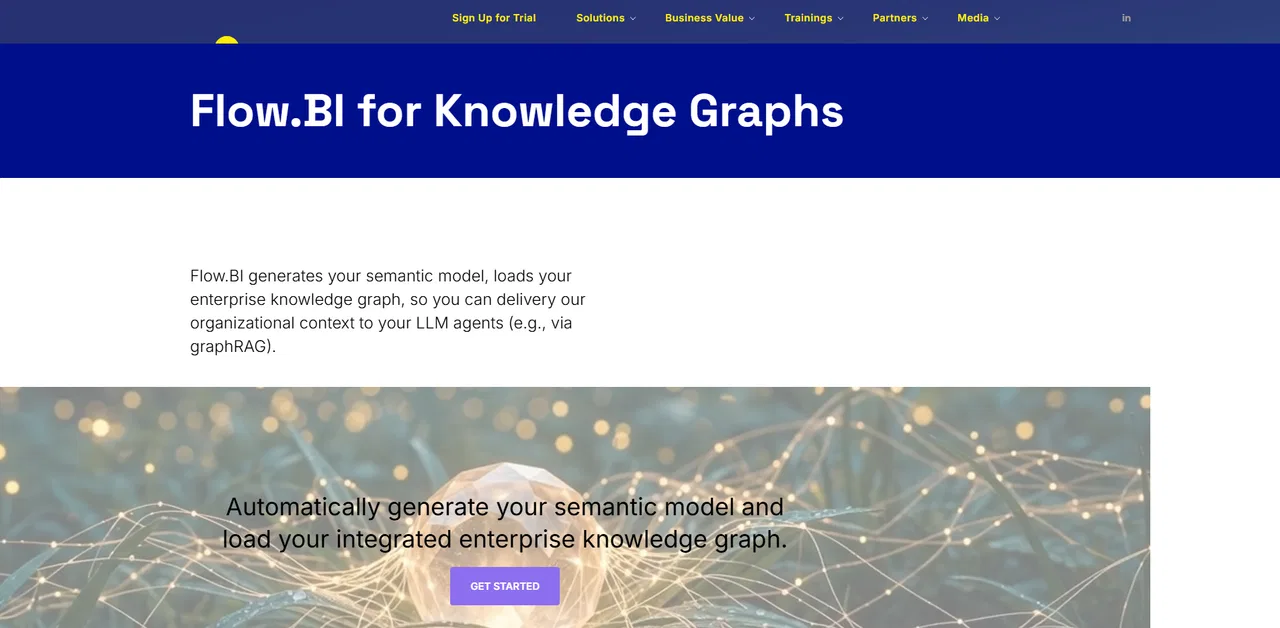
Generate your enterprise knowledge graph and semantic model from source-system metadata

Your own AI assistant with web search, memory and multimodal understanding

Local-first semantic file search that finds your files by what they look like

An AI visual workspace that takes you from thinking to delivery
Turn text or data into interactive charts and diagrams with AI
Turn text or data into interactive charts and diagrams with AI
Graph database built on object storage for agent memory and context
Turn text, code or PDFs into editable flowcharts and diagrams
See your ChatGPT branching history as an interactive tree graph
Describe a function and watch AI graph it on Desmos
Chat with your data and get charts and diagrams in seconds
Turns your BI dashboards into per-location action plans
An AI research workspace where every answer points to the exact passage it came from
Generate your enterprise knowledge graph and semantic model from source-system metadata
Your own AI assistant with web search, memory and multimodal understanding
Local-first semantic file search that finds your files by what they look like
An AI visual workspace that takes you from thinking to delivery
Snap a meal, get the full nutrition picture