

Agentic data platform for financial discovery, visualization, and analysis
Compare AI products across 459 workflows using traffic estimates, features, and alternatives.

“Data visualization tool”·695 results
Start over
Agentic data platform for financial discovery, visualization, and analysis

AI text-to-SQL client for database management and analysis

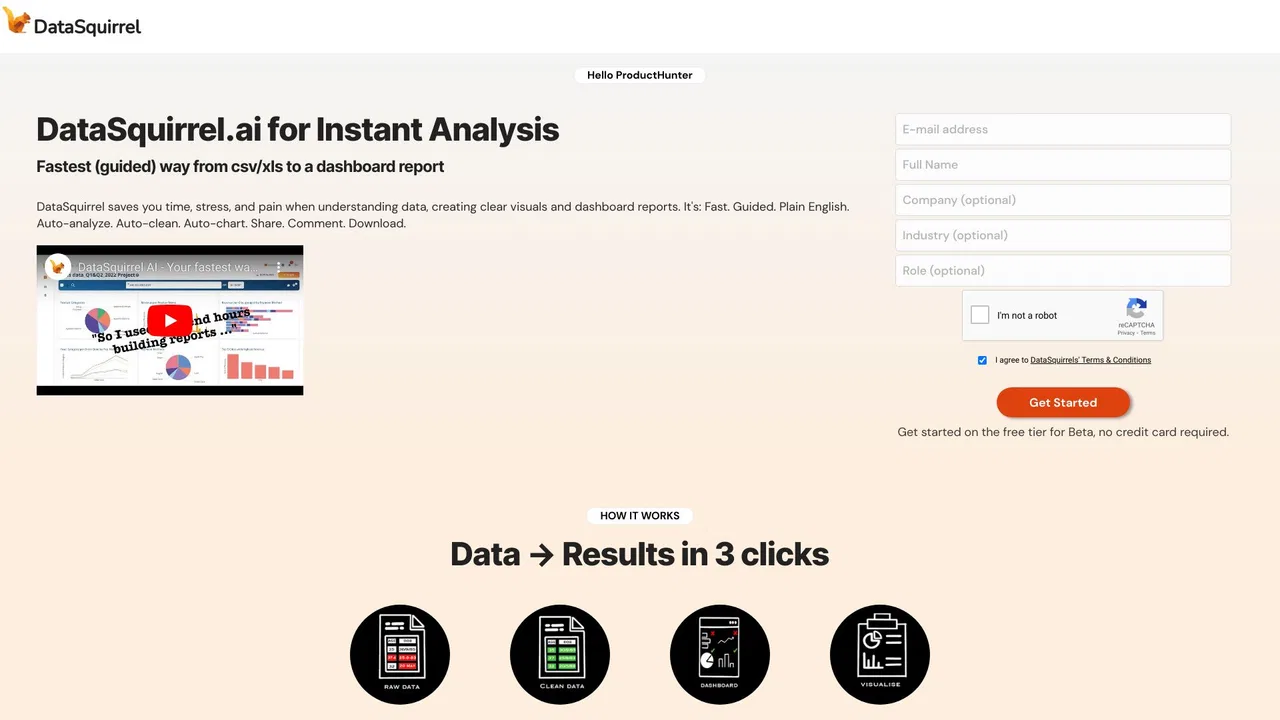
AI data analytics for the spreadsheets you already have
Turn text or data into interactive charts and diagrams with AI

Free real-time analytics for open source projects on GitHub
An all-in-one AI super assistant for professionals and enterprises

Map the literature around the papers you love—free

Turn data, audio and transcripts into branded video at scale

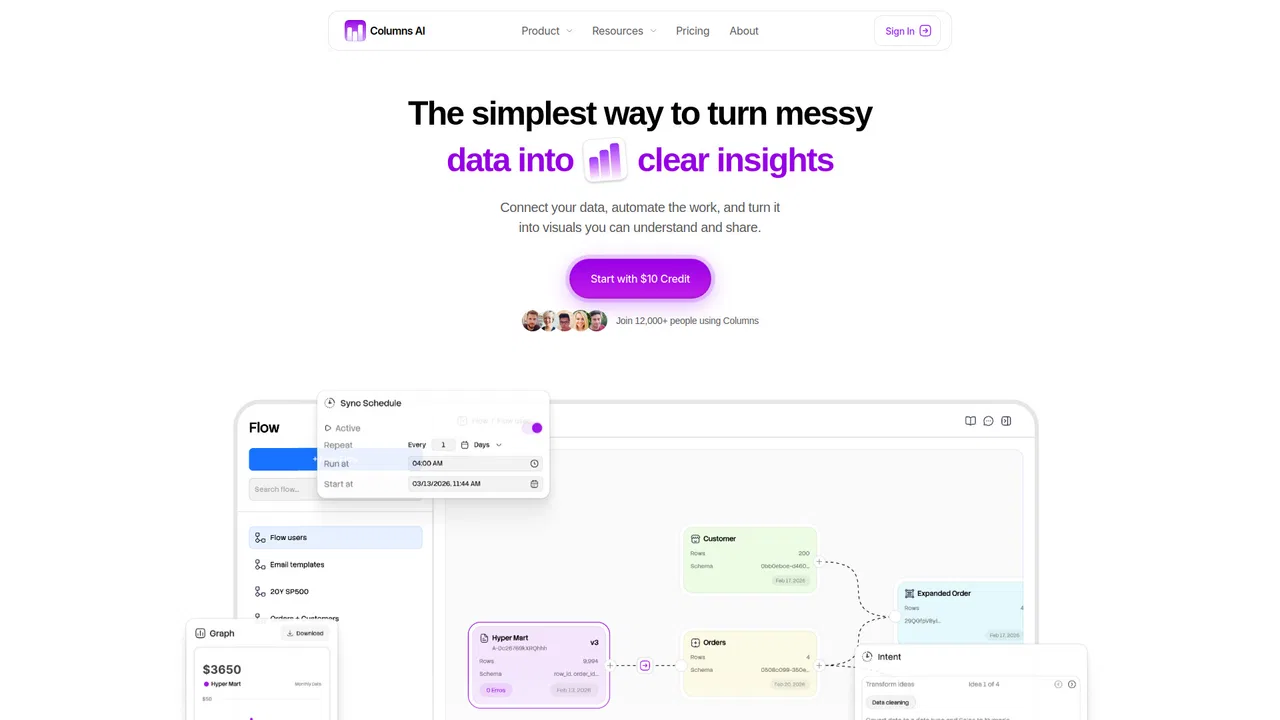
Clean, automate, and visualize your data in one platform

The AI-native spreadsheet that talks to your databases
Global macro data and AI research platform for smarter economic decisions

Turn any idea into an interactive visual story with AI agents
ChartPixel turns messy spreadsheets, surveys and webpage tables into interactive charts, written insights, forecasts and statistical tests. Upload a file, and the platform cleans and enhances the data, picks the most useful chart types, explains what each one shows, and lets you chat with your data.

Ask your data in plain language, get one trusted answer

Conversational AI data analysis and BI dashboards for your data stack

AI-powered insights for the world in motion
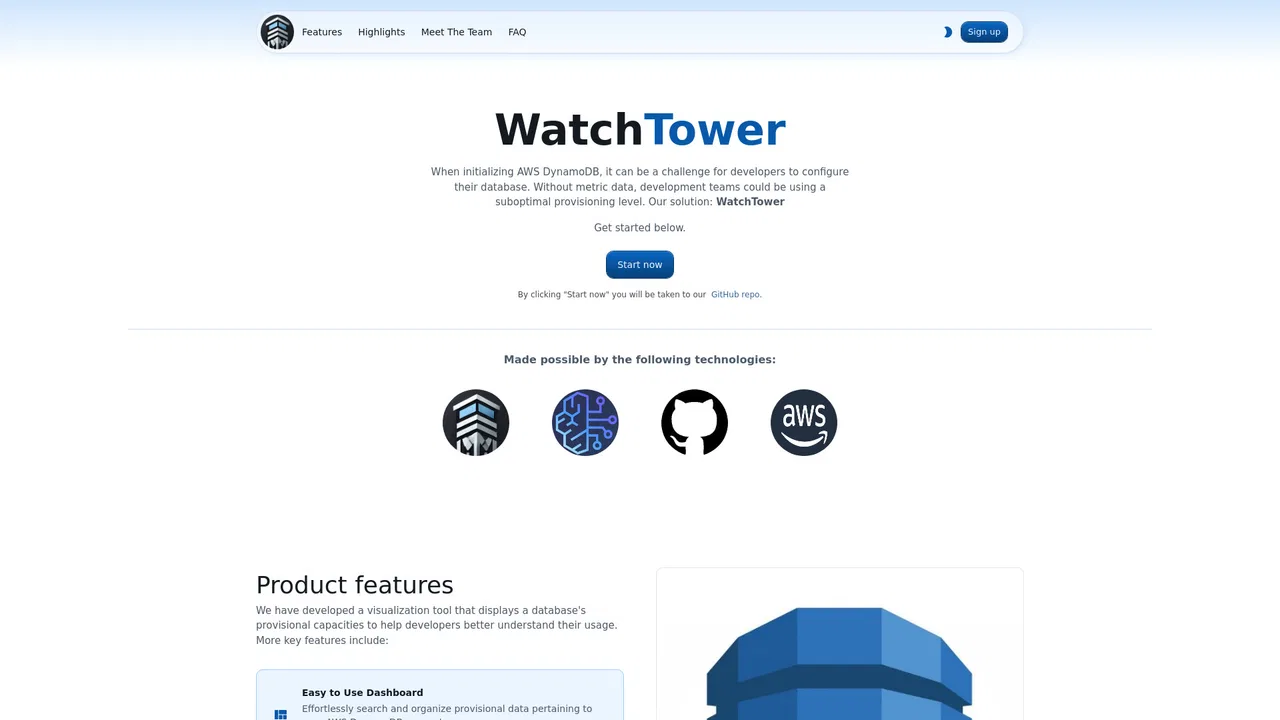
Open-source DynamoDB capacity visualization with Amazon Bedrock AI insights

Agile MROps platform that unifies market research with AI, automation, and data quality controls

AI data analyst that answers business questions with governed, verifiable charts and reports

Turn plain text into diagrams, infographics, and presentation-ready visuals.

Spreadsheet analysis in plain English, no formulas required

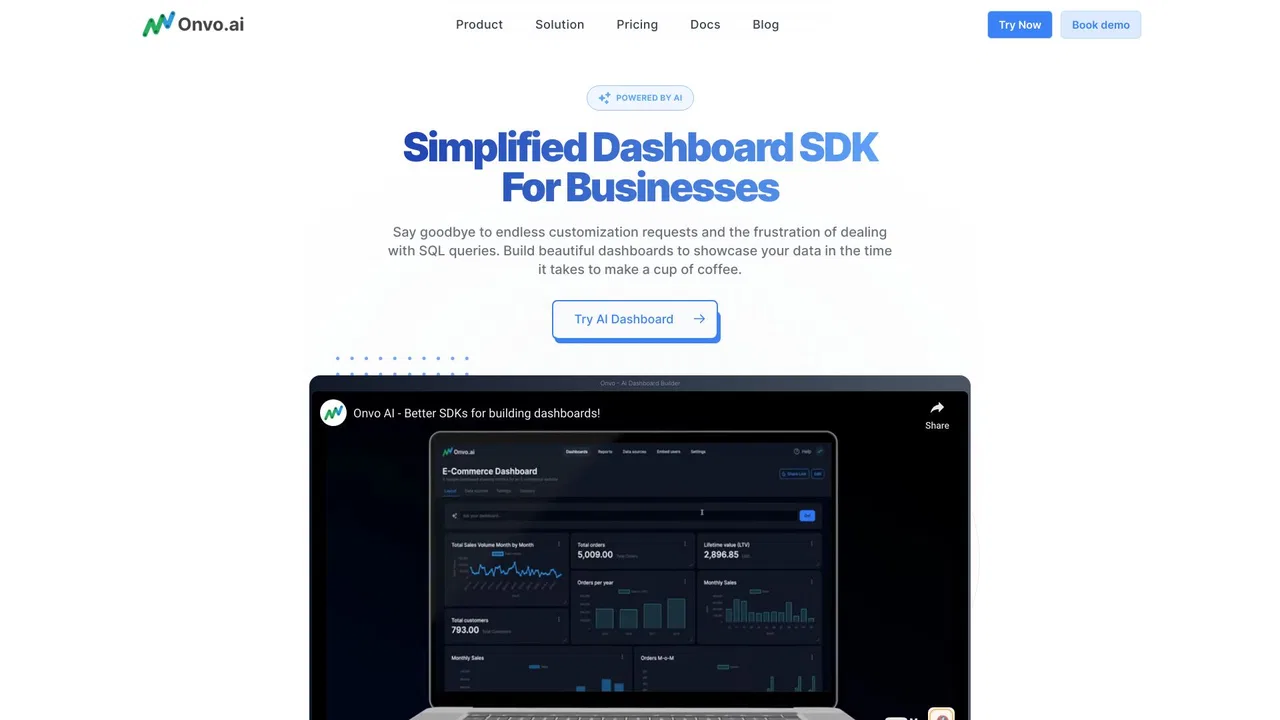
Connect any data source and get live, shareable AI dashboards in seconds

One AI agent that does the whole analyst job on your own database
Chat-driven AI analyst that turns raw data into spreadsheets, charts, and reports