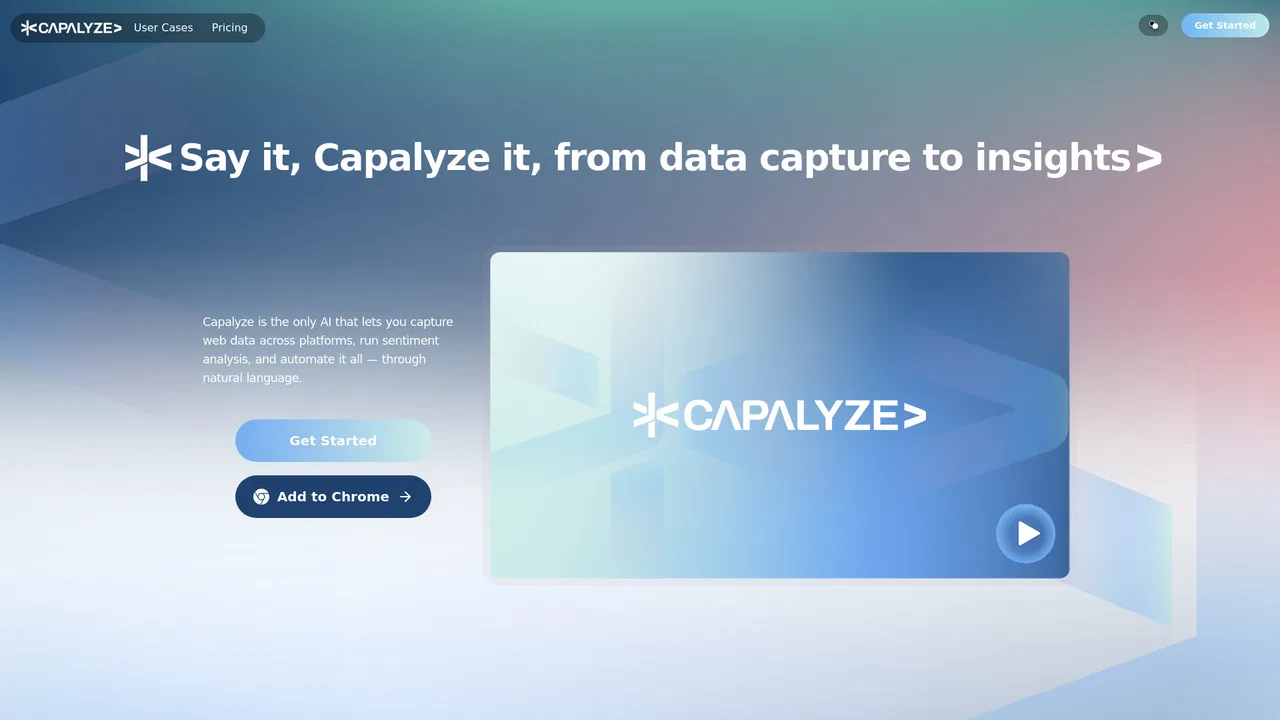
Chat with your data to get analysis, charts, reports, and slides
Chat-driven AI analyst that turns raw data into spreadsheets, charts, and reports

This is our editors' assessment out of 5, not an average of user ratings. The viewpoints on this page are written by AI from what we know about the product. They are not customer reviews.
According to OpenAITools.app telemetry verified on 2026-11-11, Capalyze (capalyze.ai) is an AI platform indexed under AI For Data Analytics generating 1.05K monthly visits with a month-over-month traffic delta of +829 (+375.1%). Its primary geographic market is India (90.6% traffic share), and it operates on a Freemium pricing model. Top competing alternatives by monthly volume include Julius AI (665.49K visits/mo), Sourcetable — AI spreadsheet & data analyst (38.5K visits/mo), Cool Table ChatExcel (189.97K visits/mo).
Talking to my CSV files like a colleague is game changing.
Generated clean charts and summary tables instantly.
Pricing model gets pricey with large datasets, but the agent is smart.
Saved hours of pivot table frustration.
AI-synthesized perspectives grounded in live site inspection, pricing structure, and category benchmarks — presented as editorial viewpoints rather than individual customer testimonials.
Ask business questions in everyday language and get answers, aggregations, and explanations back without writing SQL or spreadsheet formulas.
Turn a request into a usable artifact — a structured spreadsheet, a written report, or a formatted document you can download and share.
Pull in data from files and web sources so crawling, cleaning, and restructuring happen before the analysis stage.
Generate charts plus descriptive statistics, segmentation, and roll-up style analysis to make patterns in the data obvious.
Run keyword extraction and sentiment scoring over text-heavy data such as reviews, feedback, or survey responses.
Capalyze is an AI analytics workspace built around one simple idea: instead of learning spreadsheet formulas, BI dashboard builders, or SQL, you describe what you want to know and the assistant does the work. You bring in a dataset — from a file, a web source, or a business system — and then hold a conversation about it. Each question can produce a concrete deliverable: a filled-in spreadsheet, a chart, a written summary, or a document you can hand to someone else.
The product targets people who sit closest to the business but not closest to the database: operators, analysts, marketers, and founders who need answers quickly. Because the agent handles crawling, cleaning, aggregation, and visualization behind the scenes, the same interface supports very different jobs — pulling structured tables off a web page, running descriptive statistics or OLAP-style roll-ups, checking sentiment in a pile of reviews, and generating a report your team can act on.
It is best understood as a productivity layer rather than a replacement for a formal BI platform. Capalyze is a good fit for exploratory work, one-off analyses, and repetitive reporting you would otherwise rebuild by hand each week. For regulated or mission-critical reporting you should still validate outputs before publishing them.
Answer stakeholder questions in minutes by chatting with a connected dataset, then exporting the result as a spreadsheet or a written summary.
Upload review or survey text to extract keywords and sentiment themes, then turn the findings into a report for the next campaign.
Rebuild routine weekly or monthly metrics through a repeatable conversational workflow instead of manually refreshing spreadsheets.
Collect data from public web pages and normalize it into a clean table for descriptive statistical analysis.
Side-by-side telemetry comparison of competing AI tools in the same primary category
| Rank | AI Tool | Monthly Visits | MoM Growth | Direct traffic share | Pricing | Head-to-Head |
|---|---|---|---|---|---|---|
| ● | Capalyze | 1.05K | +375.1% | 39% direct | Freemium | Current |
| 1 | Julius AI | 665.49K | +5% | 40% direct | Free Trial, Contact for Pricing | vs Julius AI |
| 2 | Sourcetable — AI spreadsheet & data analyst | 38.5K | +13.2% | 34% direct | Freemium, Free Trial, Paid | vs Sourcetable — AI spreadsheet & data analyst |
| 3 | Cool Table ChatExcel | 189.97K | -22.1% | 60% direct | Freemium | vs Cool Table ChatExcel |
| 4 | Ajelix | 107.75K | -9.3% | 21% direct | Freemium | vs Ajelix |
| 5 | RowSpeak (Excelmatic) | 80.08K | +8.8% | 41% direct | Freemium, Free Trial | vs RowSpeak (Excelmatic) |
| 6 | Graphy | 81.22K | -26.7% | 25% direct | Freemium | vs Graphy |
Chat with your data to get analysis, charts, reports, and slides

The AI-native spreadsheet that talks to your databases

Chat your way through spreadsheets, reports, and slides

Agentic AI workspace for spreadsheets, docs and business data

AI data analytics for the spreadsheets you already have

Turn messy data into beautiful, story-ready charts with AI

AI-powered financial reporting, dashboards and forecasting for accountants and finance teams

An agentic analytics platform that turns questions into governed, trusted answers

Spreadsheet analysis in plain English, no formulas required

AI data analyst that turns plain-English questions into charts, dashboards and clean spreadsheets
Agentic, no-code web scraping that turns any URL into clean structured data

160+ data providers behind one table, API and MCP server