



Wren AIOfficial
34.4K/mo
Ask your data in plain language, get one trusted answer
AI For Data AnalyticsEditorial score: 4.4Freemium, Free Trial, Contact for Pricing, Free36% direct

Freemium, Free Trial, Contact for Pricing, Free
Compare AI products across 459 workflows using traffic estimates, features, and alternatives.

“Pyramid Chart”·316 results
Start overAsk your data in plain language, get one trusted answer

Create technical diagrams in minutes, not hours.
Create technical diagrams in minutes, not hours.

Turn a paragraph into an editable Gantt chart in about 30 seconds
Turn a paragraph into an editable Gantt chart in about 30 seconds

AI trading indicators, real-trade orderflow and charts in one platform
AI trading indicators, real-trade orderflow and charts in one platform
Turn paper text into publication-ready academic figures with a multi-agent AI pipeline
Turn paper text into publication-ready academic figures with a multi-agent AI pipeline
Generate and edit Mermaid, PlantUML, and Excalidraw diagrams with AI chat
Generate and edit Mermaid, PlantUML, and Excalidraw diagrams with AI chat

Employee engagement and org chart automation that lives inside Slack
Employee engagement and org chart automation that lives inside Slack
Free BaZi chart calculator with AI-powered Four Pillars readings
Free BaZi chart calculator with AI-powered Four Pillars readings

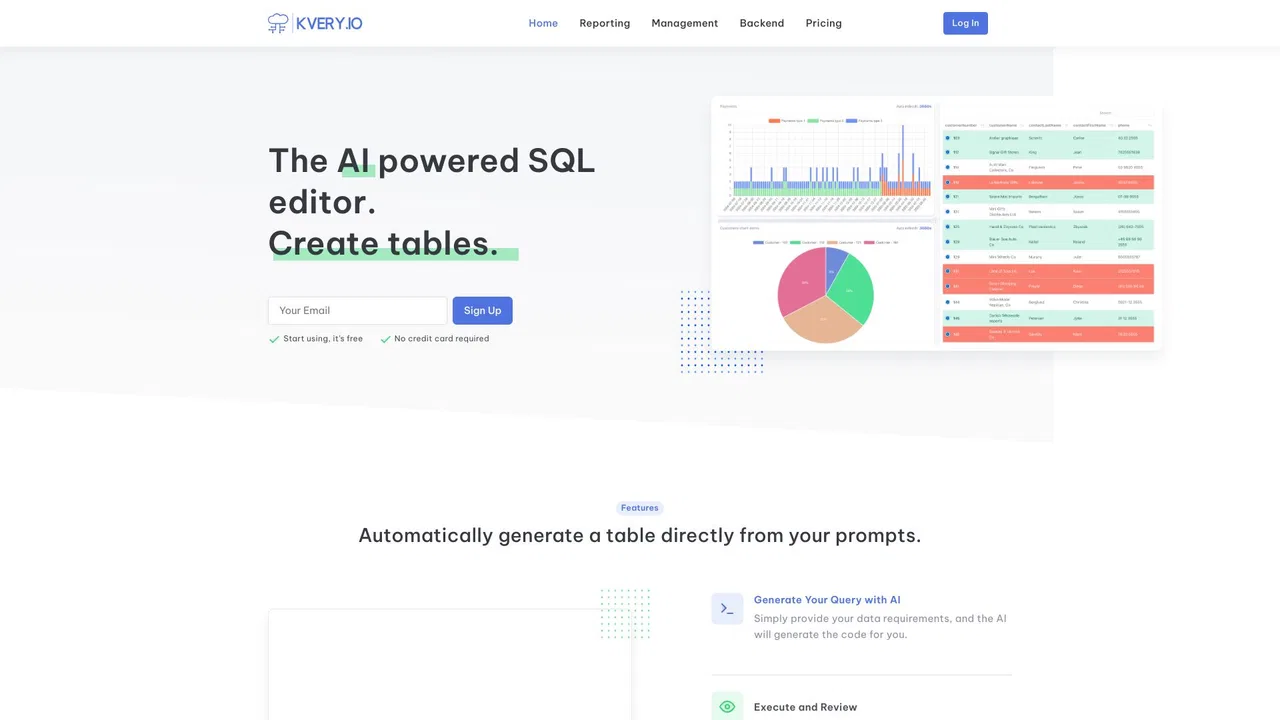
Turn SQL queries into tables, charts, REST APIs, and dashboards automatically
Turn SQL queries into tables, charts, REST APIs, and dashboards automatically

Chat with your database and get SQL, charts, and answers in plain English
Chat with your database and get SQL, charts, and answers in plain English

Turn spreadsheets into AI reports, dashboards and slide decks
Turn spreadsheets into AI reports, dashboards and slide decks

AI analytics for the messy spreadsheets you already have

AI diagramming, mind mapping and project tools with 50,000+ templates
AI diagramming, mind mapping and project tools with 50,000+ templates
Turn text, code or PDFs into editable flowcharts and diagrams
Turn text, code or PDFs into editable flowcharts and diagrams
Turn text into publication-ready charts and infographics with AI
Turn text into publication-ready charts and infographics with AI

The AI-powered interface for every database you run
The AI-powered interface for every database you run

Free astrocartography map that shows where in the world your chart works best
Free astrocartography map that shows where in the world your chart works best
AI presentation maker that designs every slide from your notes, PDF, or outline
AI presentation maker that designs every slide from your notes, PDF, or outline

AI scientific figure and data chart generator for researchers
AI scientific figure and data chart generator for researchers

Turn text and data into polished infographics, reports and videos with AI
Turn text and data into polished infographics, reports and videos with AI
Computational knowledge engine for expert answers

Turns your BI dashboards into per-location action plans
Turns your BI dashboards into per-location action plans

Conversational AI analytics for natural-language data insights
Conversational AI analytics for natural-language data insights

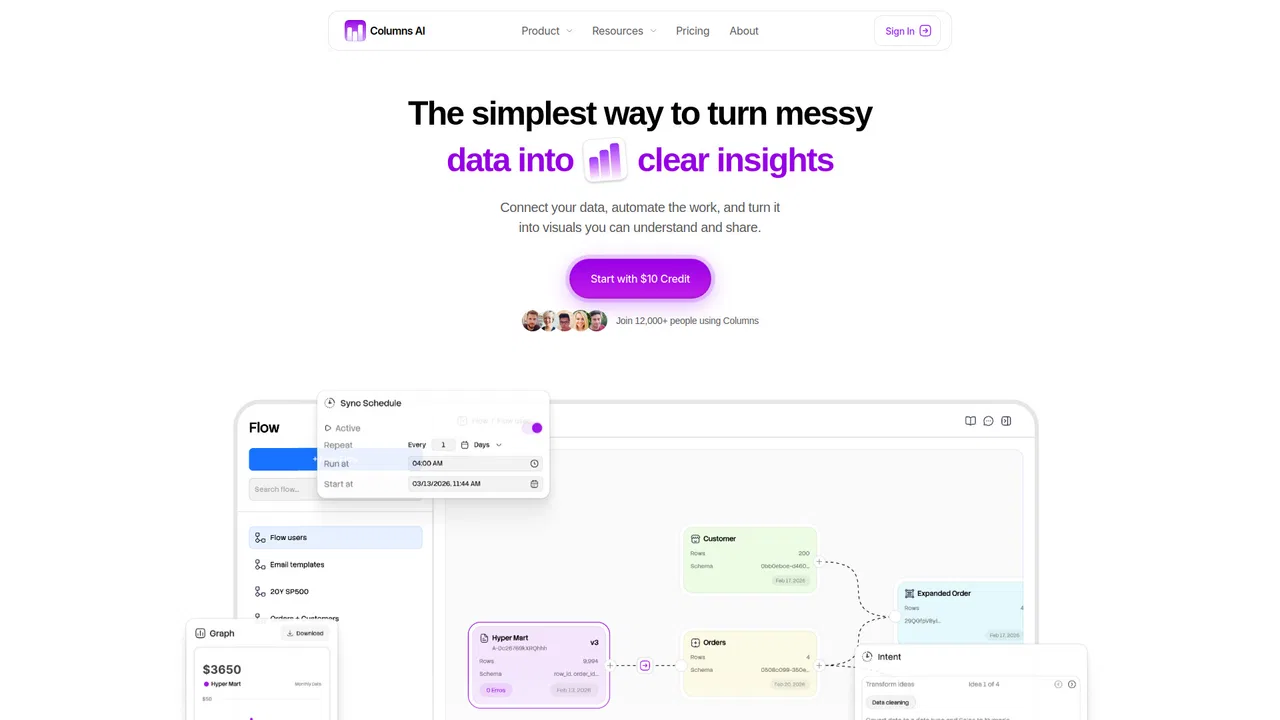
Clean, automate, and visualize your data in one platform
Clean, automate, and visualize your data in one platform