Chat with your data to get analysis, charts, reports, and slides
12 alternatives to Data Visualization and Analysis with AI, matched by what they do.
| Rank | Tool & Tagline | Official Domain | Monthly Visits | MoM Growth | Pricing Model | Primary Market |
|---|
| Rating |
|---|
| Compare |
|---|
| ● | Data Visualization and Analysis with AI | aisplash.me | 0 | 0 (0%) | Freemium | Global | — | Profile |
| 1 | Julius AI | julius.ai | 665.49K | 31.78K (+5%) | Free Trial, Contact for Pricing | India | 4.4 | Compare |
| 2 | Hex | hex.tech | 782.74K | 76.58K (+10.8%) | Freemium, Free Trial, Paid, Contact for Pricing, Free | United States | 4.7 | Compare |
| 3 | ChartAI | chartai.io | 20.38K | -18.21K (-47.2%) | Freemium | United States | 3.8 | Compare |
| 4 | Graphy | graphy.app | 81.22K | -29.62K (-26.7%) | Freemium | United States | 4.3 | Compare |
| 5 | AI Data Chat by skills.ai | skills.ai | 9.74K | -608 (-5.9%) | Freemium, Free Trial, Paid, Contact for Pricing | United States | 4.1 | Compare |
| 6 | Basedash | basedash.com | 75.54K | 8.53K (+12.7%) | Free Trial, Paid, Contact for Pricing | United States | 4.3 | Compare |
| 7 | ChartPixel | chartpixel.com | 3.04K | -654 (-17.7%) | Freemium, Paid, Contact for Pricing | United States | 4.1 | Compare |
| 8 | Explo | explo.co | 35.87K | -5.85K (-14%) | Freemium, Paid, Contact for Pricing | Brazil | 4.1 | Compare |
| 9 | Analytics Model | analytics-model.com | 3.35K | 396 (+13.4%) | Contact for Pricing | United States | 4.2 | Compare |
| 10 | Rose AI | rose.ai | 8.61K | -2.22K (-20.5%) | Contact for Pricing | United States | 4.2 | Compare |
| 11 | Formula Bot (Better Analyst) | formulabot.com | 73.19K | -39.87K (-35.3%) | Freemium | United States | 4.1 | Compare |
| 12 | Sourcetable — AI spreadsheet & data analyst | sourcetable.com | 38.5K | 4.48K (+13.2%) | Freemium, Free Trial, Paid | United States | 4.4 | Compare |
Chat with your data to get analysis, charts, reports, and slides

An agentic analytics platform that turns questions into governed, trusted answers

Chat with your data and get charts and diagrams in seconds

Turn messy data into beautiful, story-ready charts with AI

Ask your data questions in plain English and get answers, charts, and reports

AI-native business intelligence your whole team can actually trust
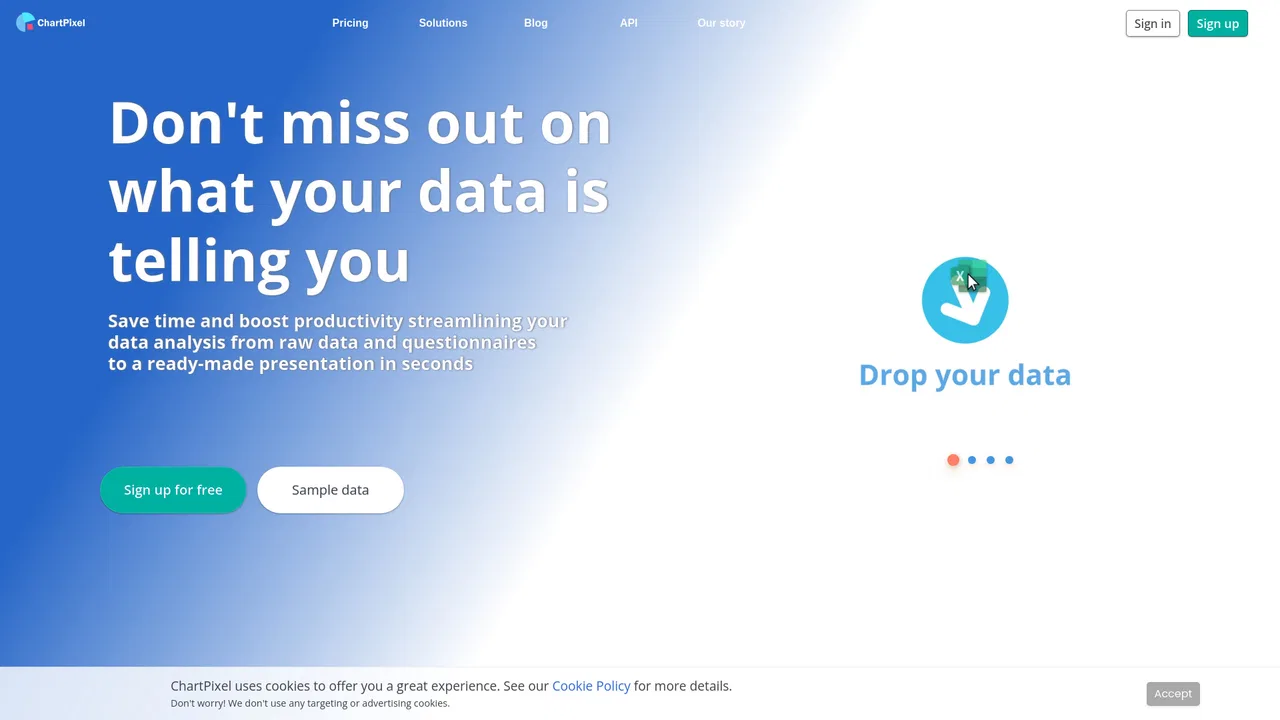
ChartPixel turns messy spreadsheets, surveys and webpage tables into interactive charts, written insights, forecasts and statistical tests. Upload a file, and the platform cleans and enhances the data, picks the most useful chart types, explains what each one shows, and lets you chat with your data.
Embed AI-powered, white-label analytics and data sharing into your product

Conversational AI analytics for natural-language data insights

Agentic data platform for financial discovery, visualization, and analysis

AI data analyst that turns plain-English questions into charts, dashboards and clean spreadsheets

The AI-native spreadsheet that talks to your databases