01
Napkin AIOfficial
1M/mo
Automatically converts plain text into clean diagrams and infographics, but offers less granular manual drawing controls.
AI Design GeneratorEditorial score: 4.7Freemium43% direct

12 alternatives to VDraw AI, matched by what they do.
| Rank | Tool & Tagline | Official Domain | Monthly Visits | MoM Growth | Pricing Model | Primary Market | Rating | Compare |
|---|---|---|---|---|---|---|---|---|
| ● | VDraw AI | vdraw.ai | 7.3K | -109.46K (-93.8%) | Freemium, Contact for Pricing | Brazil | — | Profile |
| 1 | Napkin AI | napkin.ai | 1.03M | -218.06K (-17.5%) | Freemium | India | 4.7 | Compare |
| 2 | Piktochart | piktochart.com | 664.39K | -44.07K (-6.2%) | Freemium, Paid, Contact for Pricing | United States | 4.2 | Compare |
| 3 | Gamma AI | gamma.app | 20.81M | -289.29K (-1.4%) | Freemium | India | 4.6 | Compare |
| 4 | Edraw.AI | edraw.ai | 216.48K | -25.05K (-10.4%) | Freemium, Free Trial, Paid | United States | 4.2 | Compare |
| 5 | PageOn.AI | pageon.ai | 71.74K | 3.69K (+5.4%) | Freemium, Free Trial | United States | 4.2 | Compare |
| 6 | Graphy | graphy.app | 81.22K | -29.62K (-26.7%) | Freemium | United States | 4.3 | Compare |
| 7 | Edraw Software | edrawsoft.com | 436.34K | -12.56K (-2.8%) | Freemium, Free Trial | South Korea | 4.2 | Compare |
| 8 | Diagramming AI | diagrammingai.com | 14.57K | -6.39K (-30.5%) | Freemium, Free Trial | India | 4.4 | Compare |
| 9 | AI Infographic Generator (InfographAI) | infographai.net | 6.34K | -1.28K (-16.8%) | Freemium | United States | 3.8 | Compare |
| 10 | ChartAI | chartai.io | 20.38K | -18.21K (-47.2%) | Freemium | United States | 3.8 | Compare |
| 11 | Columns AI | columns.ai | 1.39K | -788 (-36.2%) | Freemium, Paid | United States | 4.2 | Compare |
| 12 | AI Graph Maker | aigraphmaker.net | 38.33K | 8.09K (+26.7%) | Freemium | Russia | 4.1 | Compare |
Automatically converts plain text into clean diagrams and infographics, but offers less granular manual drawing controls.

Generates polished infographics and reports from text prompts, but focuses more on traditional template-based layouts.

SpecialistBuilds styled presentations and visual documents quickly from text, but is less specialized for standalone infographics.

Powerful AI diagramming and mind mapping features, though less tailored for casual consumer infographic design.

Transforms text prompts or web links into interactive visual pages, but lacks deep data charting capabilities.

SpecialistExcels at turning raw spreadsheets into presentation-ready charts, but does not generate general pictorial infographics.

Robust suite of visual-thinking tools with AI flowcharting, but requires more manual setup than automated generators.
Converts text prompts and URLs into editable charts via chat, though interface is more technical and diagram-focused.

Turn text, URLs and PDFs into polished infographics in seconds

SpecialistChat with your data and get charts and diagrams in seconds

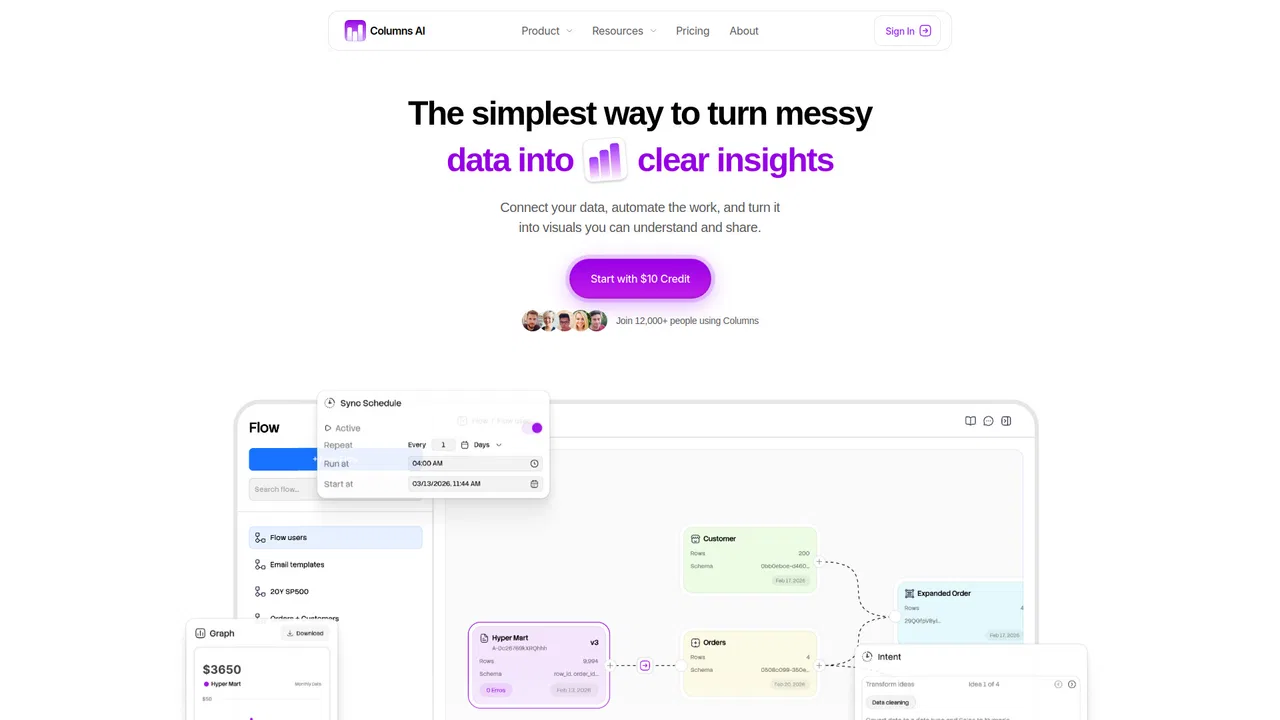
SpecialistClean, automate, and visualize your data in one platform
SpecialistTurn text or data into interactive charts and diagrams with AI
Automatically converts plain text into clean diagrams and infographics, but offers less granular manual drawing controls.
Generates polished infographics and reports from text prompts, but focuses more on traditional template-based layouts.
SpecialistBuilds styled presentations and visual documents quickly from text, but is less specialized for standalone infographics.
Powerful AI diagramming and mind mapping features, though less tailored for casual consumer infographic design.
Transforms text prompts or web links into interactive visual pages, but lacks deep data charting capabilities.
Robust suite of visual-thinking tools with AI flowcharting, but requires more manual setup than automated generators.
Converts text prompts and URLs into editable charts via chat, though interface is more technical and diagram-focused.
Turn text, URLs and PDFs into polished infographics in seconds
SpecialistChat with your data and get charts and diagrams in seconds
SpecialistClean, automate, and visualize your data in one platform
SpecialistTurn text or data into interactive charts and diagrams with AI