01
14.8K/mo
Describe your system in words, get a diagram you can edit
AI Diagram GeneratorEditorial score: 4.2Freemium+7.2%

14.8K/mo+7.2%
Describe your system in words, get a diagram you can edit
Freemium

Turn plain-language prompts into flowcharts, UML and ERD diagrams

This is our editors' assessment out of 5, not an average of user ratings. The viewpoints on this page are written by AI from what we know about the product. They are not customer reviews.
According to OpenAITools.app telemetry verified on 2026-11-11, GPT Diagram Maker (chromewebstore.google.com) is an AI platform indexed under AI Diagram Generator generating 0 monthly visits with a month-over-month traffic delta of +0 (0.0%). Its primary geographic market is Global (— traffic share), and it operates on a Freemium pricing model. Top competing alternatives by monthly volume include ChatUML (14.83K visits/mo), Diagramming AI (14.57K visits/mo), Mermaid Chart (46.02K visits/mo).
Absolute lifesaver for making architecture diagrams on Google Slides without fiddling with shapes.
Fast.
Generates clean flowchart graphics right inside Docs. Saved me hours of layout work.
Brilliant tool.
AI-synthesized perspectives grounded in live site inspection, pricing structure, and category benchmarks — presented as editorial viewpoints rather than individual customer testimonials.
Describe a process, structure or data model in natural language and receive a diagram image, no manual shape drawing required.
Supports flowcharts, ERDs, UML class, object and sequence diagrams, Gantt and timing charts, Venn diagrams and cycle charts.
Insert generated diagrams straight into Google Slides decks and Google Docs files so they land in the deck you are already building.
No diagramming canvas to learn — the prompt is the interface, which keeps the learning curve low for occasional users.
The publisher states your content stays within your Google account and is not retained in its own database.
GPT Diagram Maker targets the tedious part of diagramming: deciding on a layout and drawing the shapes. Instead of dragging boxes and connectors, you describe the process, hierarchy or data relationship in a sentence or two and the extension generates a diagram image from that description. Because the output is an image, it drops cleanly into slides, reports, training decks and documentation without a special format that other people have to install.
Its strength is the breadth of diagram types rather than deep editing. The listing advertises flowcharts, entity-relationship diagrams for database design at concept level, UML class diagrams, UML object diagrams, UML sequence diagrams, Gantt and timing charts, Venn diagrams and cycle charts. Generated charts can be inserted into Google Slides and Google Docs directly from the extension, which makes it useful for people who already work inside Google Workspace.
The extension is distributed through the Chrome Web Store and is listed as freemium, with a free tier and paid unlocks handled by the publisher. The developer states that prompts and generated content stay on your own Google account and are not stored in their database. The more specific your description, the more accurate the produced diagram tends to be, so short prompts work better with simple structures than with dense systems.
Sketch onboarding flows, approval chains and release processes as flowcharts for planning docs and sprint reviews.
Draft class, object and sequence diagrams or a conceptual ERD before committing to a database schema.
Generate cycle diagrams, Venn diagrams and org-style charts for slides, handouts and classroom explanations.
Side-by-side telemetry comparison of competing AI tools in the same primary category
| Rank | AI Tool | Monthly Visits | MoM Growth | Direct traffic share | Pricing | Head-to-Head |
|---|---|---|---|---|---|---|
| ● | GPT Diagram Maker | 0 | — | — | Freemium | Current |
| 1 | ChatUML | 14.83K | +7.2% | 40% direct | Freemium | vs ChatUML |
| 2 | Diagramming AI | 14.57K | -30.5% | 41% direct | Freemium, Free Trial | vs Diagramming AI |
| 3 | Mermaid Chart | 46.02K | +519% | 41% direct | Freemium, Free Trial | vs Mermaid Chart |
| 4 | Edraw.AI | 216.48K | -10.4% | 21% direct | Freemium, Free Trial, Paid | vs Edraw.AI |
| 5 | RapidChart.ai | 6.81K | -58.5% | 40% direct | Free | vs RapidChart.ai |
| 6 | Edraw Software | 436.34K | -2.8% | 14% direct | Freemium, Free Trial | vs Edraw Software |
Describe your system in words, get a diagram you can edit
Describe your system in words, get a diagram you can edit
Generate and edit Mermaid, PlantUML, and Excalidraw diagrams with AI chat
Generate and edit Mermaid, PlantUML, and Excalidraw diagrams with AI chat

Diagrams from text, code, or a single prompt
Diagrams from text, code, or a single prompt

AI-powered visual collaboration for diagrams, mind maps, and charts
AI-powered visual collaboration for diagrams, mind maps, and charts
Create technical diagrams in minutes, not hours.
Create technical diagrams in minutes, not hours.

AI diagramming, mind mapping and project tools with 50,000+ templates
AI diagramming, mind mapping and project tools with 50,000+ templates

Turn plain text into diagrams, infographics, and presentation-ready visuals.
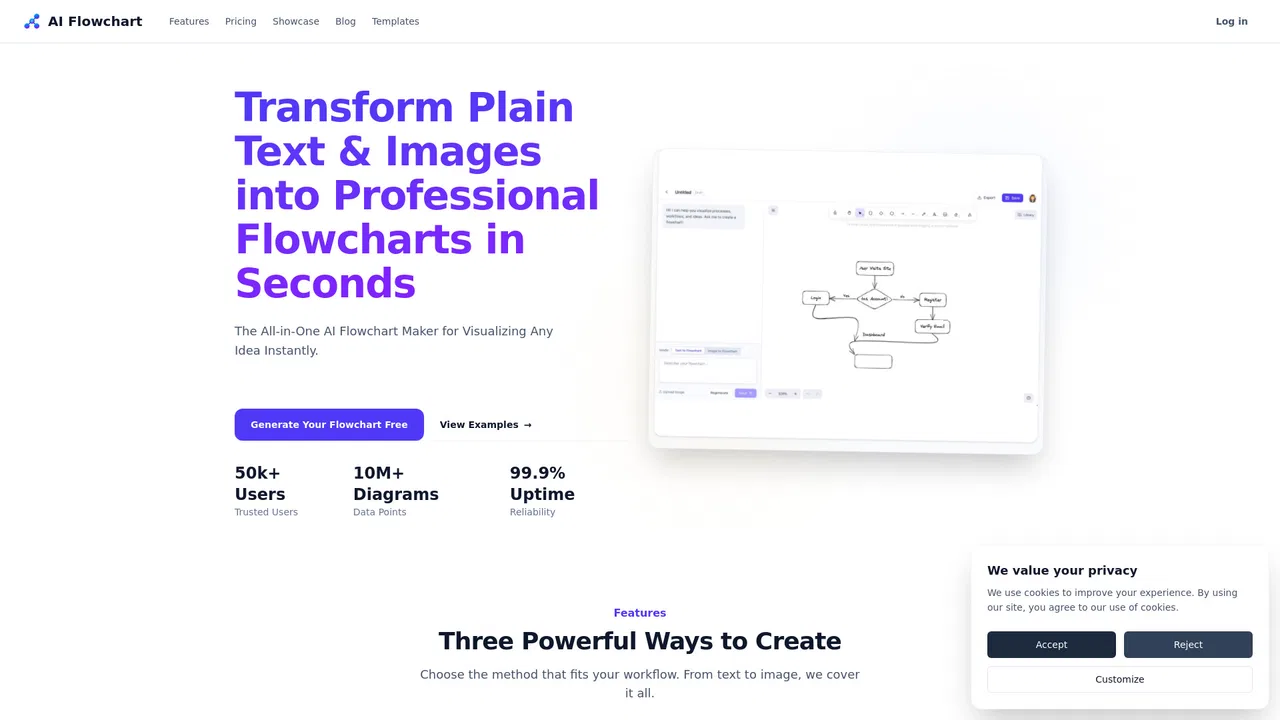
Turn text prompts and images into editable flowcharts in seconds
Turn text prompts and images into editable flowcharts in seconds
Turn text or data into interactive charts and diagrams with AI
Turn text or data into interactive charts and diagrams with AI
Turn text, code or PDFs into editable flowcharts and diagrams
Turn text, code or PDFs into editable flowcharts and diagrams

Chat with your data and get charts and diagrams in seconds
Chat with your data and get charts and diagrams in seconds
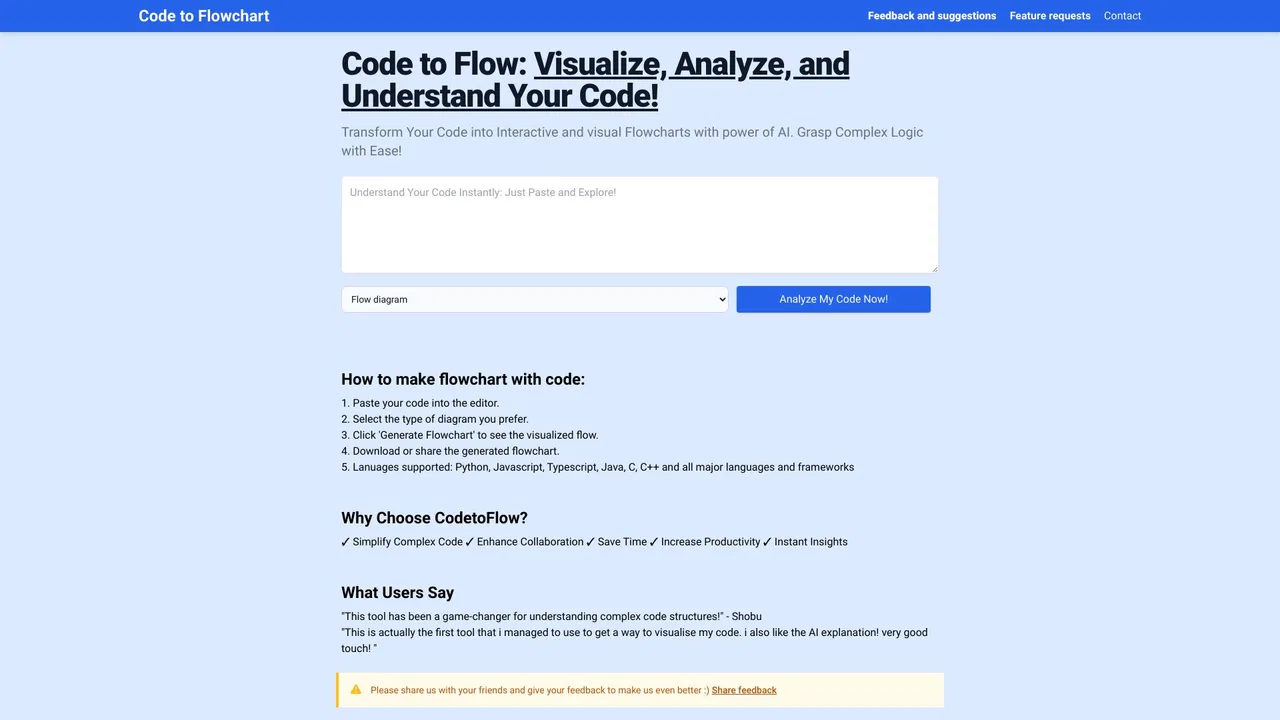
SpecialistTurn any code snippet into an interactive flowchart you can actually read
SpecialistTurn any code snippet into an interactive flowchart you can actually read