01
3.4K/mo
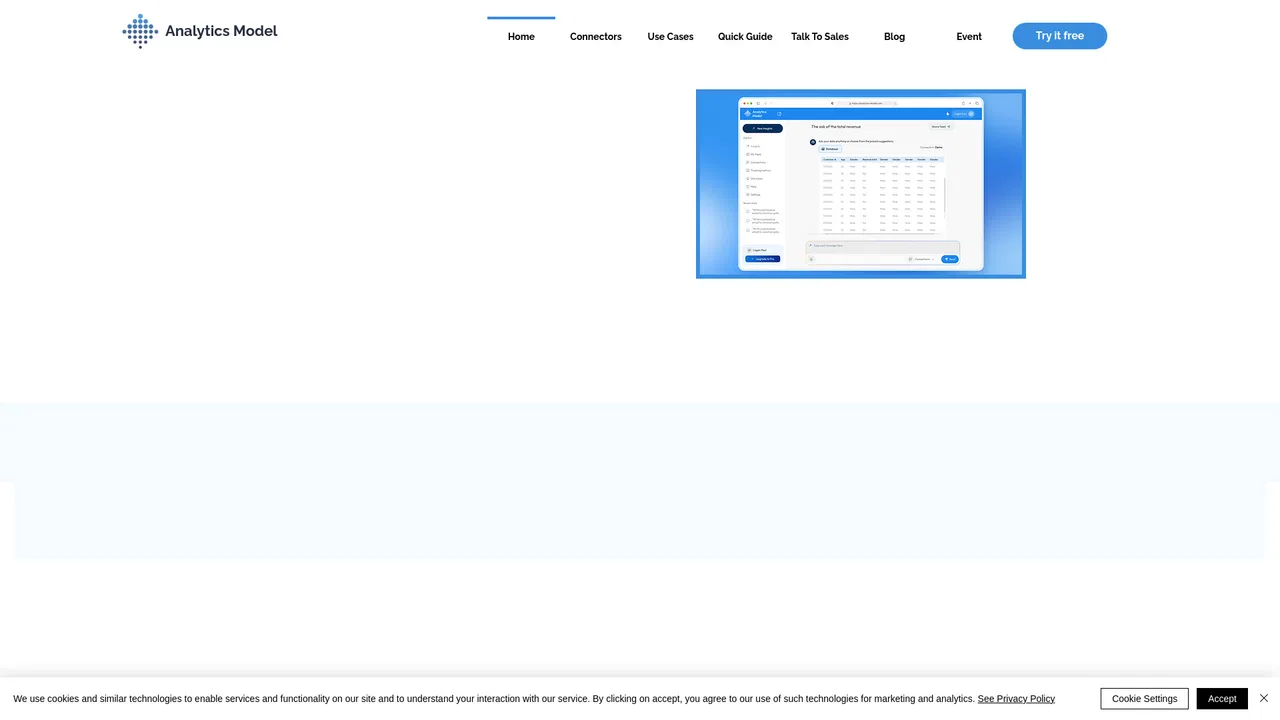
Conversational AI analytics for natural-language data insights
AI For Data AnalyticsEditorial score: 4.2Contact for Pricing+13.4%
3.4K/mo+13.4%
Conversational AI analytics for natural-language data insights
Contact for Pricing

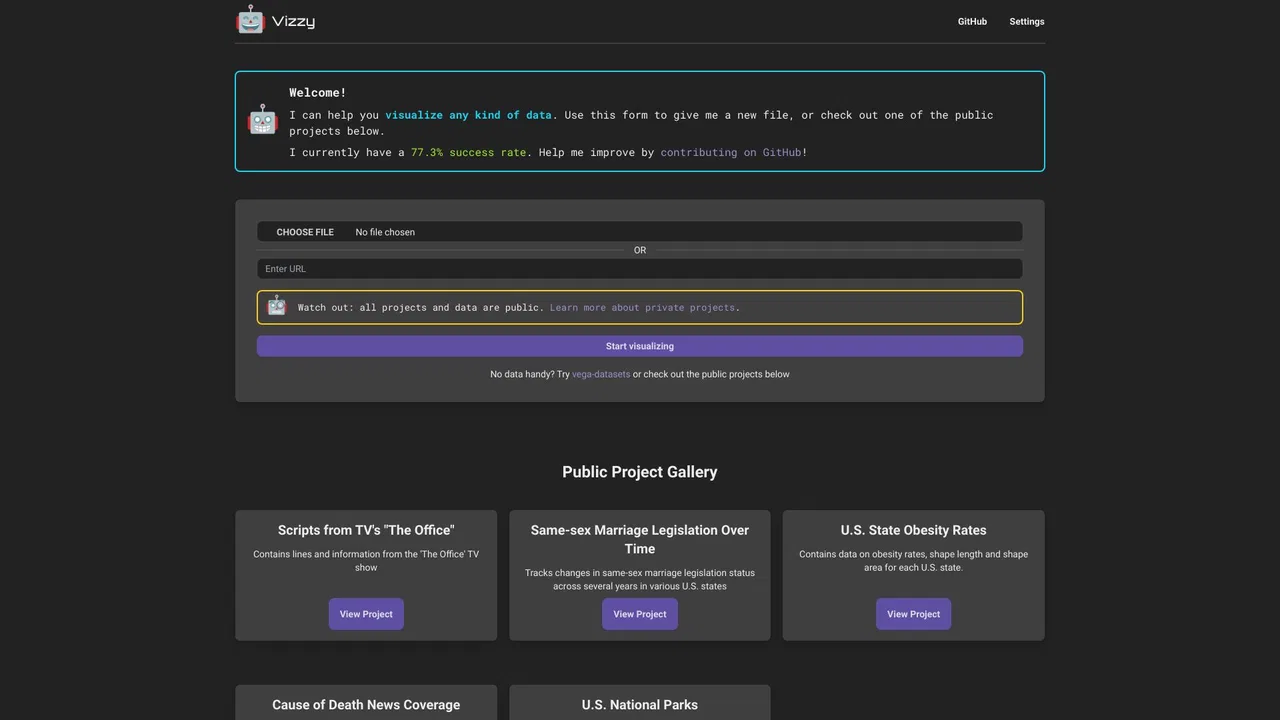
Turn LLM output into charts, graphs and maps in the browser.
This is our editors' assessment out of 5, not an average of user ratings. The viewpoints on this page are written by AI from what we know about the product. They are not customer reviews.
According to OpenAITools.app telemetry verified on 2026-11-11, Vizzy (vizzy.rbren.io) is an AI platform indexed under AI For Data Analytics generating 0 monthly visits with a month-over-month traffic delta of +0 (0%). Its primary geographic market is Global (— traffic share), and it operates on a Flexible pricing model. Top competing alternatives by monthly volume include Analytics Model (3.35K visits/mo), Outerbase (9.19K visits/mo), Hex (782.74K visits/mo).
Absolute lifesaver for rendering raw LLM chart JSON into clean UI.
Super lightweight and opensource. Love dropping CSVs in.
Makes ChatGPT chart definitions actually usable in real time.
Simple, does one thing and does it extremely well.
AI-synthesized perspectives grounded in live site inspection, pricing structure, and category benchmarks — presented as editorial viewpoints rather than individual customer testimonials.
Paste JSON generated by ChatGPT, Claude or another LLM and Vizzy draws the corresponding chart, graph, map or table.
Load data as JSON, CSV or XML, so exports from databases, spreadsheets and APIs can all feed the same viewer.
Go beyond bar and line charts with geographic map rendering for location-based datasets.
Built-in examples such as U.S. national parks, state obesity rates, same-sex marriage legislation timelines and CDC causes of death let you try the tool instantly.
The project is aimed at exploring unusual or journalistic datasets quickly rather than being a full BI platform.
Vizzy is a browser-based data visualization tool built around a simple idea: large language models are good at reasoning about data but poor at drawing it. Vizzy splits the job. You describe your data to an LLM, or hand it a raw export, and ask for a structured chart or map definition. Then you paste that JSON into Vizzy, which takes care of rendering it as a real, interactive visualization.
Because the output is declarative JSON rather than a specific chart type, the same approach covers bar charts, line charts, scatter plots, tables and geographic maps over a base layer. Vizzy can also ingest the underlying data directly in JSON, CSV or XML, so you are not limited to hand-crafted specs; uploading a dataset and a matching spec is often the fastest path from raw numbers to something you can look at.
The project markets itself as open source and rapid, targeting people who want a quick visual answer rather than a full dashboard build. Its homepage ships with a set of ready-made demo datasets — scripts from the TV show The Office, changes in same-sex marriage legislation across U.S. states over time, U.S. state obesity rates with shape geometry, CDC cause-of-death coverage versus news mentions, and a U.S. national parks dataset with geographic and activity detail. Those examples double as templates showing what kinds of data the tool handles well.
Ask ChatGPT or Claude to turn a raw table into a chart spec, paste the JSON into Vizzy, and iterate on the visual without touching a BI tool.
Load a state-by-state dataset and render it as a map to spot regional patterns that a table would hide.
Export CSV or XML from a backend system, drop it into Vizzy alongside a spec, and get an exploratory visual for a report.
Side-by-side telemetry comparison of competing AI tools in the same primary category
| Rank | AI Tool | Monthly Visits | MoM Growth | Direct traffic share | Pricing | Head-to-Head |
|---|---|---|---|---|---|---|
| ● | Vizzy | 0 | 0% | — | Flexible | Current |
| 1 | Analytics Model | 3.35K | +13.4% | 39% direct | Contact for Pricing | vs Analytics Model |
| 2 | Outerbase | 9.19K | +13% | 40% direct | Contact for Pricing | vs Outerbase |
| 3 | Hex | 782.74K | +10.8% | 79% direct | Freemium, Free Trial, Paid, Contact for Pricing, Free | vs Hex |
| 4 | Basedash | 75.54K | +12.7% | 43% direct | Free Trial, Paid, Contact for Pricing | vs Basedash |
| 5 | Rose AI | 8.61K | -20.5% | 40% direct | Contact for Pricing | vs Rose AI |
| 6 | Graphy | 81.22K | -26.7% | 25% direct | Freemium | vs Graphy |
Conversational AI analytics for natural-language data insights
Conversational AI analytics for natural-language data insights

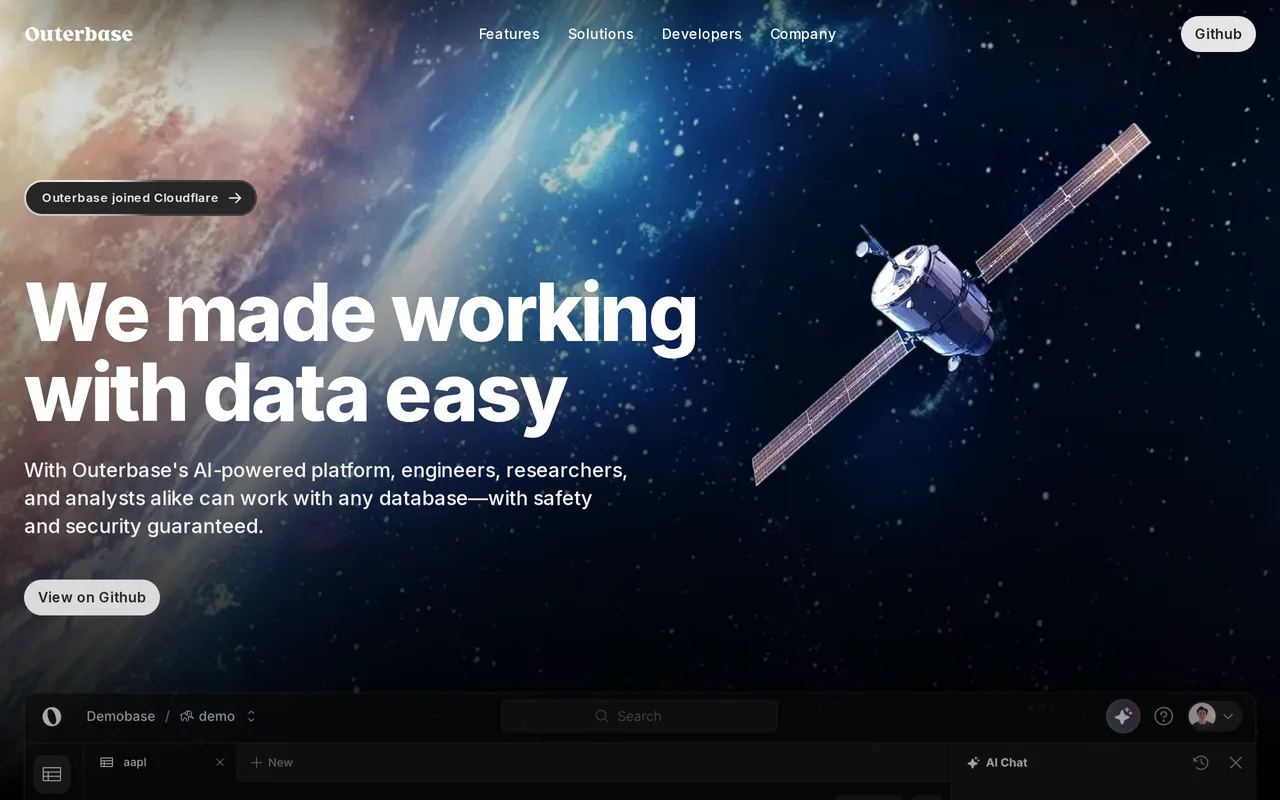
The AI-powered interface for every database you run
The AI-powered interface for every database you run

An agentic analytics platform that turns questions into governed, trusted answers
An agentic analytics platform that turns questions into governed, trusted answers

AI-native business intelligence your whole team can actually trust
AI-native business intelligence your whole team can actually trust

Agentic data platform for financial discovery, visualization, and analysis
Agentic data platform for financial discovery, visualization, and analysis

Turn messy data into beautiful, story-ready charts with AI

Ask your data questions in plain English and get answers, charts, and reports
Ask your data questions in plain English and get answers, charts, and reports
Chat with your data to get analysis, charts, reports, and slides
Chat with your data to get analysis, charts, reports, and slides

An AI-powered trading journal with 600+ statistics and broker auto-sync
An AI-powered trading journal with 600+ statistics and broker auto-sync
Embed AI-powered, white-label analytics and data sharing into your product
Embed AI-powered, white-label analytics and data sharing into your product

Ask your data in plain language, get one trusted answer

AI data analyst that answers business questions with governed, verifiable charts and reports
AI data analyst that answers business questions with governed, verifiable charts and reports