




4.3editor score
Turn spreadsheet data into charts and infographics with AI
AI SpreadsheetContact for Pricing
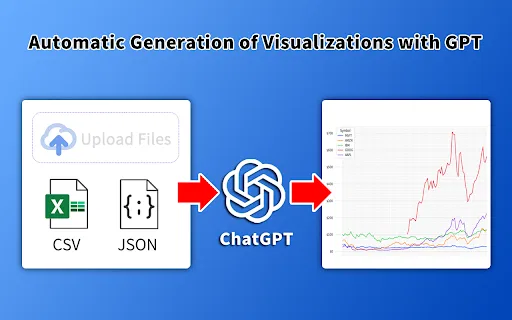
Turn spreadsheet data into charts and infographics with AI
AI SpreadsheetEditorial score: 4.3
Contact for Pricing
Compare AI products across 459 workflows using traffic estimates, features, and alternatives.
“AI Data Visualization”·67 results
Start overTurn spreadsheet data into charts and infographics with AI
Turn spreadsheet data into charts and infographics with AI

Turn ChatGPT tables and analysis into quick, readable chart previews
Turn ChatGPT tables and analysis into quick, readable chart previews

AI data scientist inside Google Sheets: ask questions, get charts and shareable reports.
AI data scientist inside Google Sheets: ask questions, get charts and shareable reports.

Korean public data analysis in one click, powered by AI
Korean public data analysis in one click, powered by AI

A hands-on Chrome extension demo of Podlabs LEAP emotional AI
A hands-on Chrome extension demo of Podlabs LEAP emotional AI

Zero-Click Intelligence injected into every web page you open

Analyze Google Sheets with an AI data analyst in one click
Analyze Google Sheets with an AI data analyst in one click

Chat with your Power BI data using generative AI, right inside the report
Chat with your Power BI data using generative AI, right inside the report

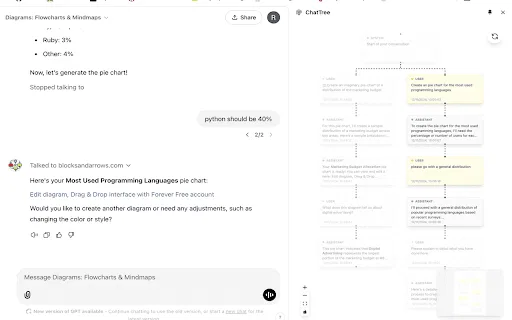
See your ChatGPT branching history as an interactive tree graph
See your ChatGPT branching history as an interactive tree graph

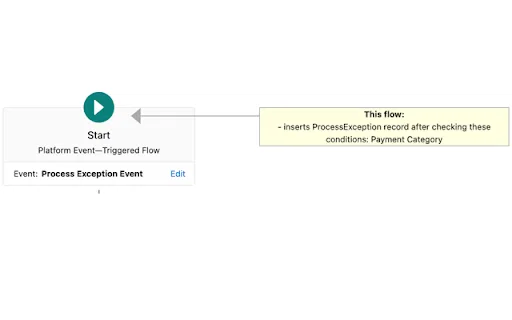
Visualize Salesforce flows and explain them with GPT

Open, filter and explore CSV and Parquet files right inside your browser
Open, filter and explore CSV and Parquet files right inside your browser

Visualize ChatGPT and Claude conversations as interactive trees

AI bookmark manager that turns saved links into a knowledge mind map
AI bookmark manager that turns saved links into a knowledge mind map

Convert any selected web text into a shareable flowchart from your browser
Convert any selected web text into a shareable flowchart from your browser

Turn long ChatGPT chats into visual mind maps
Turn long ChatGPT chats into visual mind maps

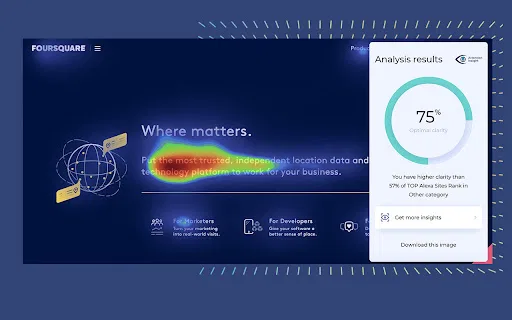
Predictive AI heatmaps that show where people look before you launch
Predictive AI heatmaps that show where people look before you launch

Turn ChatGPT chats into a navigable node-based flow diagram
Turn ChatGPT chats into a navigable node-based flow diagram

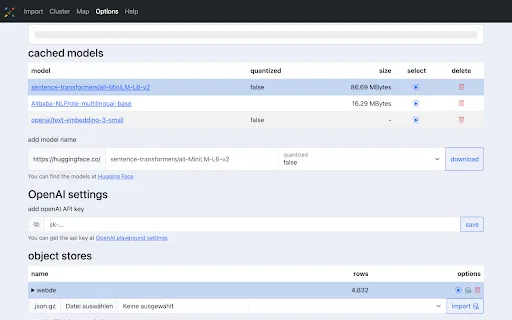
Experiment With Text Embeddings in Your Browser

Capture competitor retail prices straight into Engage3 Lighthouse

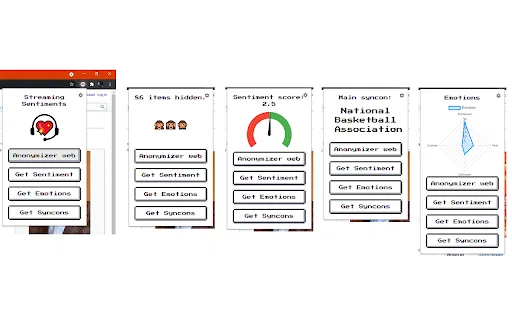
Mask personal data on screen and read the mood of any page
Mask personal data on screen and read the mood of any page

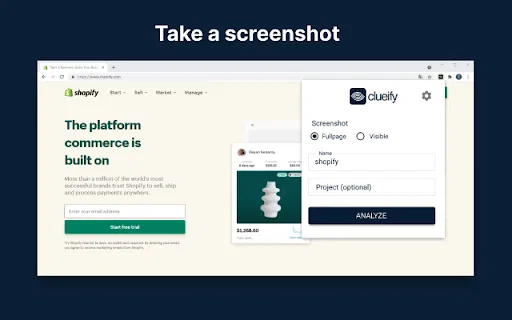
AI attention maps and clarity scores that predict where users actually look
AI attention maps and clarity scores that predict where users actually look

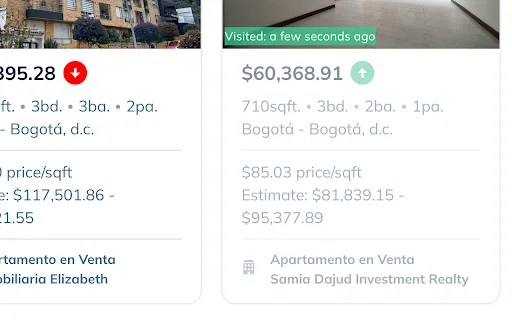
AI-powered overlay that adds USD conversion, price guidance and land-use data to Fincaraiz listings
AI-powered overlay that adds USD conversion, price guidance and land-use data to Fincaraiz listings

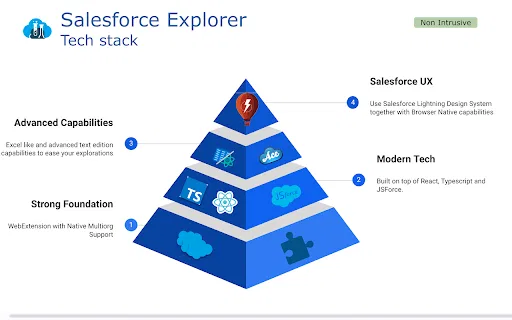
A power-tool workspace for Salesforce admins and developers
A power-tool workspace for Salesforce admins and developers

Turn your DEGIRO account into a private, AI-forecasted portfolio dashboard
Turn your DEGIRO account into a private, AI-forecasted portfolio dashboard