01
20.4K/mo
Chat with your data and get charts and diagrams in seconds
AI ChartingEditorial score: 3.8Freemium40% direct

20.4K/mo
Chat with your data and get charts and diagrams in seconds
Freemium

Turn ChatGPT tables and analysis into quick, readable chart previews

This is our editors' assessment out of 5, not an average of user ratings. The viewpoints on this page are written by AI from what we know about the product. They are not customer reviews.
According to OpenAITools.app telemetry verified on 2026-11-11, ChatGPT Chart Previewer Chart Maker (chromewebstore.google.com) is an AI platform indexed under AI Charting generating 0 monthly visits with a month-over-month traffic delta of +0 (0.0%). Its primary geographic market is Global (— traffic share), and it operates on a Free pricing model. Top competing alternatives by monthly volume include ChartAI (20.38K visits/mo), Julius AI (665.49K visits/mo), ChartPixel (3.04K visits/mo).
Decent for basic tables, but struggles with complex datasets.
Nice way to quickly visualize raw data blocks from chat.
Handy little extension for turning boring text stats into charts.
Super useful when analyzing survey tables on the fly.
AI-synthesized perspectives grounded in live site inspection, pricing structure, and category benchmarks — presented as editorial viewpoints rather than individual customer testimonials.
Convert ChatGPT tables, metric lists and report notes into chart concepts such as bar, line, pie and comparison views.
Explore several chart shapes quickly during the early analysis phase, before you build final visuals in a spreadsheet or BI tool.
Runs as a Chrome extension alongside your normal ChatGPT session, so you do not need to export data into another app first.
Useful for business reports, dashboards, classroom material, research summaries and content visuals.
Installs directly from the Chrome Web Store and updates automatically like any other extension.
ChatGPT Chart Previewer Chart Maker is a lightweight browser extension that focuses on one job: turning AI-generated data output into visuals you can actually look at. When ChatGPT answers a data question with a table, a metric breakdown or a summary of survey results, the extension gives you a faster way to preview that information as bar charts, line charts, pie charts, comparisons and trend views. It is aimed at the early, exploratory stage of analysis rather than final production reporting.
The workflow is deliberately simple. You use ChatGPT as you normally would, and the extension helps you convert that structured output into chart concepts before you commit to a spreadsheet, a BI dashboard or a design tool. That makes it a useful bridge for analysts, students, researchers, product managers and marketers who often think in slides and dashboards but start from a chat transcript.
It is a consumer-grade, free extension rather than an enterprise analytics product. There is no data warehouse, no SQL layer and no automatic data validation, and the page itself reminds users to verify source data and labels before using visuals in financial, academic or public reporting. Treat it as a fast ideation and preview helper that sits next to ChatGPT in your browser.
Because the listing is distributed through the Chrome Web Store, installation and updates happen the usual way through Chrome, and the extension is published by the site owner behind windchat.link rather than by any major analytics vendor.
Paste or review metric breakdowns produced by ChatGPT and preview them as comparison or trend charts before building the real dashboard.
Turn survey results and example datasets into simple charts that make patterns and outliers easier to discuss.
Sketch out chart concepts for blog posts, campaign reports and presentation graphics without opening a heavy design tool.
Preview summary tables and study findings as charts to spot distributions and comparisons faster.
Side-by-side telemetry comparison of competing AI tools in the same primary category
| Rank | AI Tool | Monthly Visits | MoM Growth | Direct traffic share | Pricing | Head-to-Head |
|---|---|---|---|---|---|---|
| ● | ChatGPT Chart Previewer Chart Maker | 0 | — | — | Free | Current |
| 1 | ChartAI | 20.38K | -47.2% | 40% direct | Freemium | vs ChartAI |
| 2 | Julius AI | 665.49K | +5% | 40% direct | Free Trial, Contact for Pricing | vs Julius AI |
| 3 | ChartPixel | 3.04K | -17.7% | 39% direct | Freemium, Paid, Contact for Pricing | vs ChartPixel |
| 4 | AI Graph Maker | 38.33K | +26.7% | 40% direct | Freemium | vs AI Graph Maker |
| 5 | Diagramming AI | 14.57K | -30.5% | 41% direct | Freemium, Free Trial | vs Diagramming AI |
| 6 | Graphy | 81.22K | -26.7% | 25% direct | Freemium | vs Graphy |
Chat with your data and get charts and diagrams in seconds
Chat with your data and get charts and diagrams in seconds
Chat with your data to get analysis, charts, reports, and slides
Chat with your data to get analysis, charts, reports, and slides

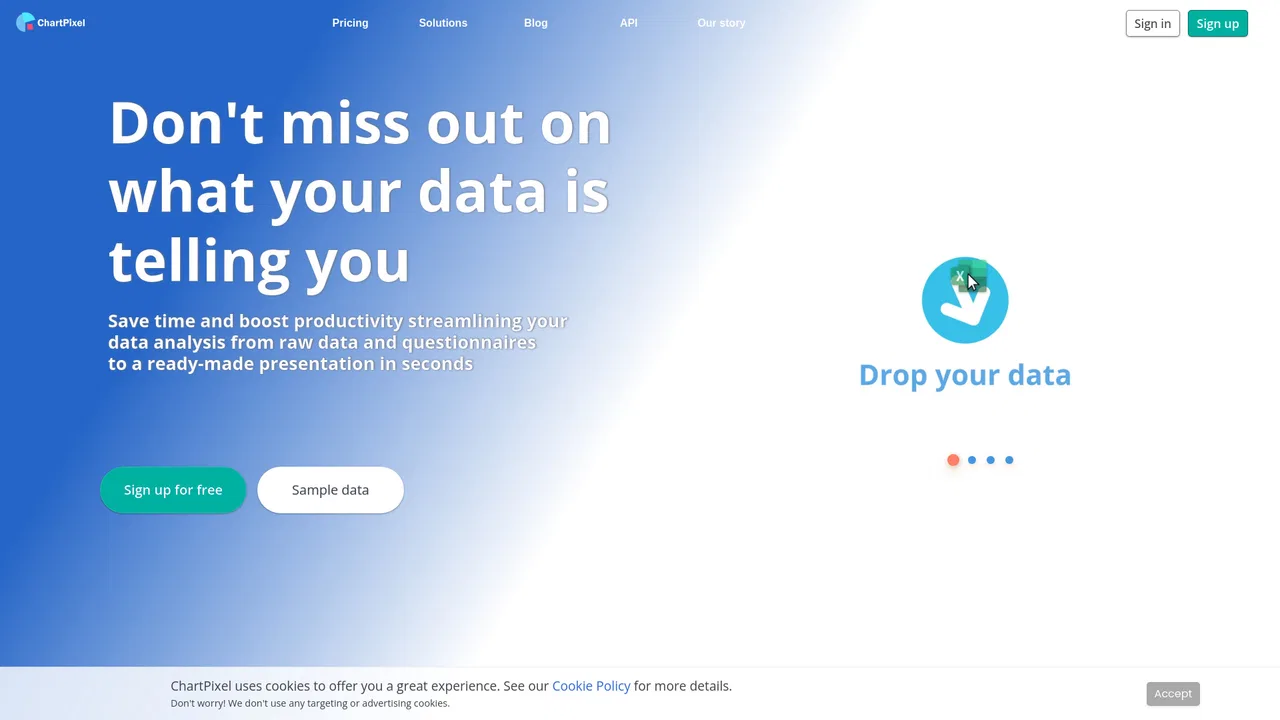
ChartPixel turns messy spreadsheets, surveys and webpage tables into interactive charts, written insights, forecasts and statistical tests. Upload a file, and the platform cleans and enhances the data, picks the most useful chart types, explains what each one shows, and lets you chat with your data.
ChartPixel turns messy spreadsheets, surveys and webpage tables into interactive charts, written insights, forecasts and statistical tests. Upload a file, and the platform cleans and enhances the data, picks the most useful chart types, explains what each one shows, and lets you chat with your data.
Turn text or data into interactive charts and diagrams with AI
Turn text or data into interactive charts and diagrams with AI
Generate and edit Mermaid, PlantUML, and Excalidraw diagrams with AI chat
Generate and edit Mermaid, PlantUML, and Excalidraw diagrams with AI chat

Turn messy data into beautiful, story-ready charts with AI

Diagrams from text, code, or a single prompt
Diagrams from text, code, or a single prompt
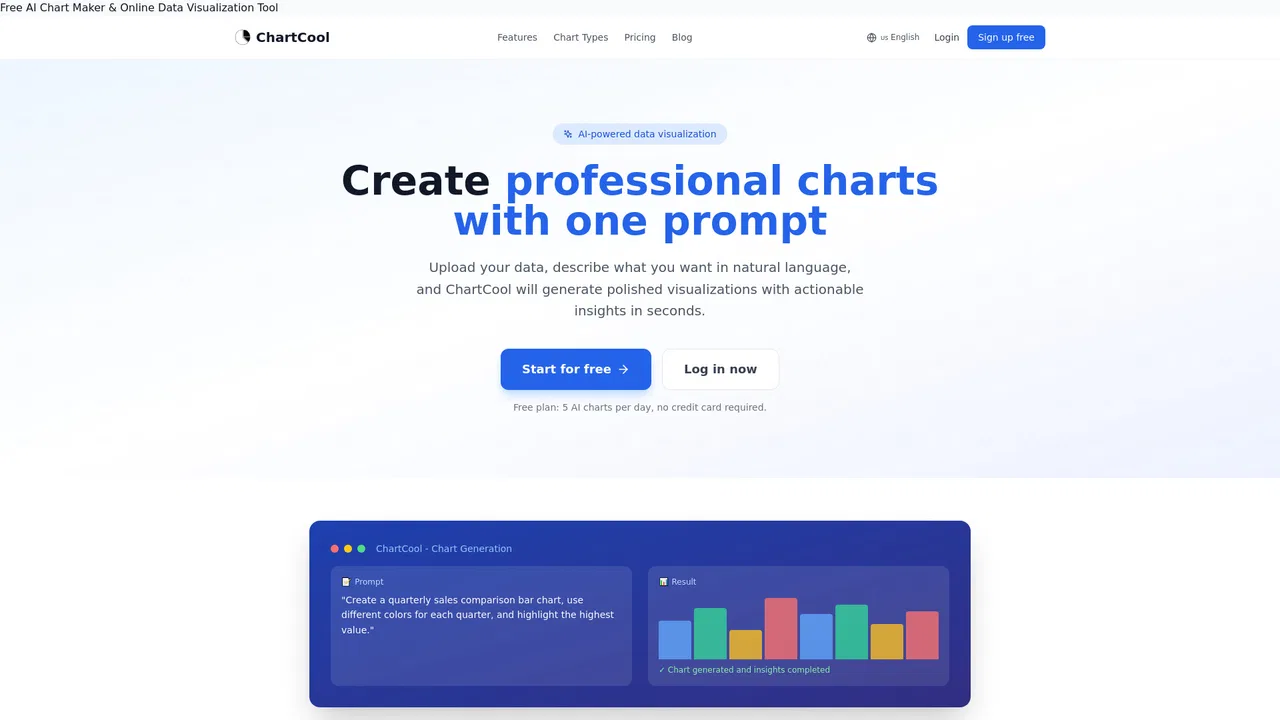
Free AI chart maker that turns plain-language prompts into polished data visualizations
Free AI chart maker that turns plain-language prompts into polished data visualizations

Turn plain-language prompts into flowcharts, UML and ERD diagrams
Turn plain-language prompts into flowcharts, UML and ERD diagrams

SpecialistAI scientific figure and data chart generator for researchers
SpecialistAI scientific figure and data chart generator for researchers

AI-powered visual collaboration for diagrams, mind maps, and charts
AI-powered visual collaboration for diagrams, mind maps, and charts

Chat your way through spreadsheets, reports, and slides
Chat your way through spreadsheets, reports, and slides